Immigrants from Chile 4 or more Vehicles in Household

COMPARE

Immigrants from Chile
Race
Ancestry
AfghanAfricanAlaska NativeAlaskan AthabascanAlbanianAleutAlsatianAmericanApacheArabArapahoArgentineanArmenianAssyrian/Chaldean/SyriacAustralianAustrianBahamianBangladeshiBarbadianBasqueBelgianBelizeanBermudanBhutaneseBlackfeetBolivianBrazilianBritishBritish West IndianBulgarianBurmeseCajunCambodianCanadianCape VerdeanCarpatho RusynCelticCentral AmericanCentral American IndianCherokeeCheyenneChickasawChileanChineseChippewaChoctawColombianColvilleComancheCosta RicanCreeCreekCroatianCrowCubanCypriotCzechCzechoslovakianDanishDelawareDominicanDutchDutch West IndianEastern EuropeanEcuadorianEgyptianEnglishEstonianEthiopianEuropeanFijianFilipinoFinnishFrenchFrench American IndianFrench CanadianGermanGerman RussianGhanaianGreekGuamanian/ChamorroGuatemalanGuyaneseHaitianHmongHonduranHopiHoumaHungarianIcelanderIndian (Asian)IndonesianInupiatIranianIraqiIrishIroquoisIsraeliItalianJamaicanJapaneseJordanianKenyanKiowaKoreanLaotianLatvianLebaneseLiberianLithuanianLumbeeLuxembourgerMacedonianMalaysianMalteseMarshalleseMenomineeMexicanMexican American IndianMongolianMoroccanNative HawaiianNavajoNepaleseNew ZealanderNicaraguanNigerianNorthern EuropeanNorwegianOkinawanOsageOttawaPaiutePakistaniPalestinianPanamanianParaguayanPennsylvania GermanPeruvianPimaPolishPortuguesePotawatomiPuebloPuerto RicanPuget Sound SalishRomanianRussianSalvadoranSamoanScandinavianScotch-IrishScottishSeminoleSenegaleseSerbianShoshoneSierra LeoneanSiouxSlavicSlovakSloveneSomaliSouth AfricanSouth AmericanSouth American IndianSoviet UnionSpaniardSpanishSpanish AmericanSpanish American IndianSri LankanSubsaharan AfricanSudaneseSwedishSwissSyrianTaiwaneseThaiTlingit-HaidaTohono O'OdhamTonganTrinidadian and TobagonianTsimshianTurkishU.S. Virgin IslanderUgandanUkrainianUruguayanUteVenezuelanVietnameseWelshWest IndianYakamaYaquiYugoslavianYumanYup'ikZimbabwean
Immigration
NonimmigrantsImmigrantsAfghanistanAfricaAlbaniaArgentinaArmeniaAsiaAustraliaAustriaBahamasBangladeshBarbadosBelarusBelgiumBelizeBoliviaBosnia and HerzegovinaBrazilBulgariaBurma/MyanmarCabo VerdeCambodiaCameroonCanadaCaribbeanCentral AmericaChileChinaColombiaCongoCosta RicaCroatiaCubaCzechoslovakiaDenmarkDominicaDominican RepublicEastern AfricaEastern AsiaEastern EuropeEcuadorEgyptEl SalvadorEnglandEritreaEthiopiaEuropeFijiFranceGermanyGhanaGreeceGrenadaGuatemalaGuyanaHaitiHondurasHong KongHungaryIndiaIndonesiaIranIraqIrelandIsraelItalyJamaicaJapanJordanKazakhstanKenyaKoreaKuwaitLaosLatin AmericaLatviaLebanonLiberiaLithuaniaMalaysiaMexicoMicronesiaMiddle AfricaMoldovaMoroccoNepalNetherlandsNicaraguaNigeriaNorth AmericaNorth MacedoniaNorthern AfricaNorthern EuropeNorwayOceaniaPakistanPanamaPeruPhilippinesPolandPortugalRomaniaRussiaSaudi ArabiaScotlandSenegalSerbiaSierra LeoneSingaporeSomaliaSouth AfricaSouth AmericaSouth Central AsiaSouth Eastern AsiaSouthern EuropeSpainSri LankaSt. Vincent and the GrenadinesSudanSwedenSwitzerlandSyriaTaiwanThailandTrinidad and TobagoTurkeyUgandaUkraineUruguayUzbekistanVenezuelaVietnamWest IndiesWestern AfricaWestern AsiaWestern EuropeYemenZaireZimbabweAzores
Select to Compare
Race
Ancestry
AfghanAfricanAlaska NativeAlaskan AthabascanAlbanianAleutAlsatianAmericanApacheArabArapahoArgentineanArmenianAssyrian/Chaldean/SyriacAustralianAustrianBahamianBangladeshiBarbadianBasqueBelgianBelizeanBermudanBhutaneseBlackfeetBolivianBrazilianBritishBritish West IndianBulgarianBurmeseCajunCambodianCanadianCape VerdeanCarpatho RusynCelticCentral AmericanCentral American IndianCherokeeCheyenneChickasawChileanChineseChippewaChoctawColombianColvilleComancheCosta RicanCreeCreekCroatianCrowCubanCypriotCzechCzechoslovakianDanishDelawareDominicanDutchDutch West IndianEastern EuropeanEcuadorianEgyptianEnglishEstonianEthiopianEuropeanFijianFilipinoFinnishFrenchFrench American IndianFrench CanadianGermanGerman RussianGhanaianGreekGuamanian/ChamorroGuatemalanGuyaneseHaitianHmongHonduranHopiHoumaHungarianIcelanderIndian (Asian)IndonesianInupiatIranianIraqiIrishIroquoisIsraeliItalianJamaicanJapaneseJordanianKenyanKiowaKoreanLaotianLatvianLebaneseLiberianLithuanianLumbeeLuxembourgerMacedonianMalaysianMalteseMarshalleseMenomineeMexicanMexican American IndianMongolianMoroccanNative HawaiianNavajoNepaleseNew ZealanderNicaraguanNigerianNorthern EuropeanNorwegianOkinawanOsageOttawaPaiutePakistaniPalestinianPanamanianParaguayanPennsylvania GermanPeruvianPimaPolishPortuguesePotawatomiPuebloPuerto RicanPuget Sound SalishRomanianRussianSalvadoranSamoanScandinavianScotch-IrishScottishSeminoleSenegaleseSerbianShoshoneSierra LeoneanSiouxSlavicSlovakSloveneSomaliSouth AfricanSouth AmericanSouth American IndianSoviet UnionSpaniardSpanishSpanish AmericanSpanish American IndianSri LankanSubsaharan AfricanSudaneseSwedishSwissSyrianTaiwaneseThaiTlingit-HaidaTohono O'OdhamTonganTrinidadian and TobagonianTsimshianTurkishU.S. Virgin IslanderUgandanUkrainianUruguayanUteVenezuelanVietnameseWelshWest IndianYakamaYaquiYugoslavianYumanYup'ikZimbabwean
Immigration
NonimmigrantsImmigrantsAfghanistanAfricaAlbaniaArgentinaArmeniaAsiaAustraliaAustriaBahamasBangladeshBarbadosBelarusBelgiumBelizeBoliviaBosnia and HerzegovinaBrazilBulgariaBurma/MyanmarCabo VerdeCambodiaCameroonCanadaCaribbeanCentral AmericaChinaColombiaCongoCosta RicaCroatiaCubaCzechoslovakiaDenmarkDominicaDominican RepublicEastern AfricaEastern AsiaEastern EuropeEcuadorEgyptEl SalvadorEnglandEritreaEthiopiaEuropeFijiFranceGermanyGhanaGreeceGrenadaGuatemalaGuyanaHaitiHondurasHong KongHungaryIndiaIndonesiaIranIraqIrelandIsraelItalyJamaicaJapanJordanKazakhstanKenyaKoreaKuwaitLaosLatin AmericaLatviaLebanonLiberiaLithuaniaMalaysiaMexicoMicronesiaMiddle AfricaMoldovaMoroccoNepalNetherlandsNicaraguaNigeriaNorth AmericaNorth MacedoniaNorthern AfricaNorthern EuropeNorwayOceaniaPakistanPanamaPeruPhilippinesPolandPortugalRomaniaRussiaSaudi ArabiaScotlandSenegalSerbiaSierra LeoneSingaporeSomaliaSouth AfricaSouth AmericaSouth Central AsiaSouth Eastern AsiaSouthern EuropeSpainSri LankaSt. Vincent and the GrenadinesSudanSwedenSwitzerlandSyriaTaiwanThailandTrinidad and TobagoTurkeyUgandaUkraineUruguayUzbekistanVenezuelaVietnamWest IndiesWestern AfricaWestern AsiaWestern EuropeYemenZaireZimbabweAzores
4 or more Vehicles in Household
Income
Poverty
Unemployment
Labor Participation
Family Structure
Vehicle Availability
Education Level
Disability

Immigrants from Chile 4 or more Vehicles in Household
Poor

6.1%
4+ VEHICLES AVAILABLE
16.9/ 100
METRIC RATING
207th/ 347
METRIC RANK

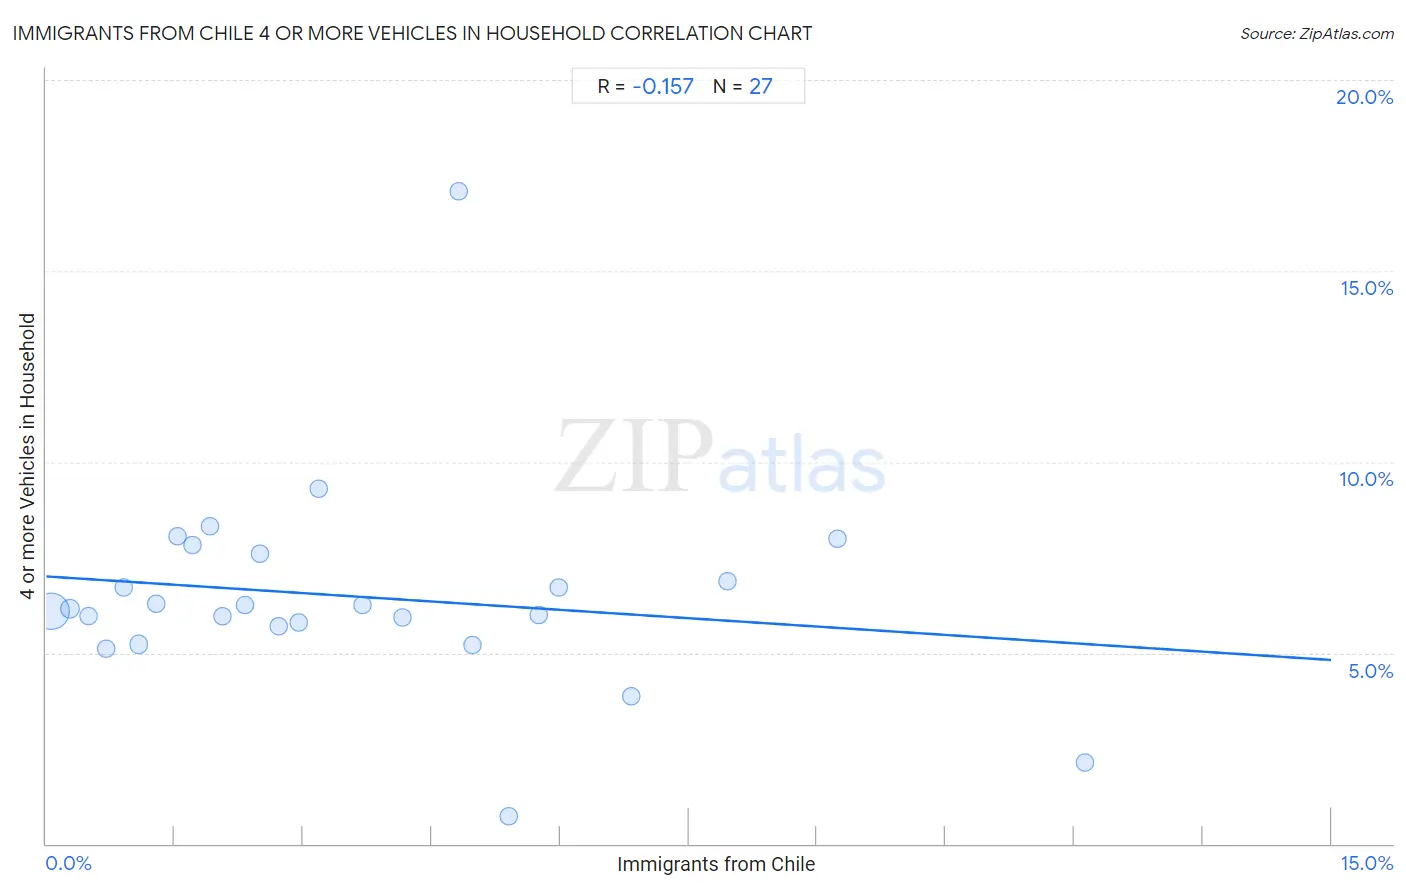
Immigrants from Chile 4 or more Vehicles in Household Correlation Chart

The statistical analysis conducted on geographies consisting of 217,712,613 people shows a poor negative correlation between the proportion of Immigrants from Chile and percentage of households with 4 or more vehicles available in the United States with a correlation coefficient (R) of -0.157 and weighted average of 6.1%. On average, for every 1% (one percent) increase in Immigrants from Chile within a typical geography, there is a decrease of 0.15% in percentage of households with 4 or more vehicles available.
Immigrants from Chile 4 or more Vehicles in Household
It is essential to understand that the correlation between the percentage of Immigrants from Chile and percentage of households with 4 or more vehicles available does not imply a direct cause-and-effect relationship. It remains uncertain whether the presence of Immigrants from Chile influences an upward or downward trend in the level of percentage of households with 4 or more vehicles available within an area, or if Immigrants from Chile simply ended up residing in those areas with higher or lower levels of percentage of households with 4 or more vehicles available due to other factors.

Demographics Similar to Immigrants from Chile by 4 or more Vehicles in Household

In terms of 4 or more vehicles in household, the demographic groups most similar to Immigrants from Chile are Immigrants from Nigeria (6.1%, a difference of 0.27%), Kenyan (6.1%, a difference of 0.28%), Immigrants from Honduras (6.1%, a difference of 0.30%), Immigrants from Zimbabwe (6.0%, a difference of 0.35%), and Honduran (6.1%, a difference of 0.42%).
DemographicsRating | Rank4 or more Vehicles in Household
Latvians
21.7
/100
|
#200
Fair
6.1%
Egyptians
21.4
/100
|
#201
Fair
6.1%
Immigrants from South Central Asia
21.3
/100
|
#202
Fair
6.1%
Immigrants from Sierra Leone
20.5
/100
|
#203
Fair
6.1%
Immigrants from Belize
19.8
/100
|
#204
Poor
6.1%
Hondurans
19.3
/100
|
#205
Poor
6.1%
Kenyans
18.5
/100
|
#206
Poor
6.1%
Immigrants from Chile
16.9
/100
|
#207
Poor
6.1%
Immigrants from Nigeria
15.6
/100
|
#208
Poor
6.1%
Immigrants from Honduras
15.4
/100
|
#209
Poor
6.1%
Immigrants from Zimbabwe
15.1
/100
|
#210
Poor
6.0%
Panamanians
14.8
/100
|
#211
Poor
6.0%
Immigrants from Egypt
14.7
/100
|
#212
Poor
6.0%
Arabs
14.4
/100
|
#213
Poor
6.0%
Immigrants from Austria
14.3
/100
|
#214
Poor
6.0%

Immigrants from Chile 4 or more Vehicles in Household Correlation Summary

MeasurementImmigrants from Chile Data4 or more Vehicles in Household Data
Minimum0.054%0.72%
Maximum12.1%17.1%
Range12.1%16.4%
Mean3.6%6.5%
Median2.7%6.1%
Interquartile 25% (IQ1)1.3%5.7%
Interquartile 75% (IQ3)5.4%7.6%
Interquartile Range (IQR)4.1%1.9%
Standard Deviation (Sample)3.0%2.8%
Standard Deviation (Population)2.9%2.7%

Correlation Details

Immigrants from Chile PercentileSample Size4 or more Vehicles in Household
[
0.0%
-
0.5%
]
0.054%
197,156,0076.1%
[
0.0%
-
0.5%
]
0.28%
13,402,2506.1%
[
0.0%
-
0.5%
]
0.49%
4,059,5086.0%
[
0.5%
-
1.0%
]
0.70%
1,357,7345.1%
[
0.5%
-
1.0%
]
0.90%
647,7316.7%
[
1.0%
-
1.5%
]
1.08%
549,3815.2%
[
1.0%
-
1.5%
]
1.29%
210,6436.3%
[
1.5%
-
2.0%
]
1.53%
60,6208.1%
[
1.5%
-
2.0%
]
1.70%
60,6457.8%
[
1.5%
-
2.0%
]
1.92%
54,8768.3%
[
2.0%
-
2.5%
]
2.06%
47,4355.9%
[
2.0%
-
2.5%
]
2.32%
17,4126.3%
[
2.0%
-
2.5%
]
2.49%
24,6327.6%
[
2.5%
-
3.0%
]
2.72%
7,9445.7%
[
2.5%
-
3.0%
]
2.95%
20,9715.8%
[
3.0%
-
3.5%
]
3.18%
5,1289.3%
[
3.5%
-
4.0%
]
3.69%
5,8616.2%
[
4.0%
-
4.5%
]
4.16%
9855.9%
[
4.5%
-
5.0%
]
4.81%
18717.1%
[
4.5%
-
5.0%
]
4.97%
8,4505.2%
[
5.0%
-
5.5%
]
5.40%
5370.72%
[
5.5%
-
6.0%
]
5.75%
7,3076.0%
[
5.5%
-
6.0%
]
5.98%
2,1926.7%
[
6.5%
-
7.0%
]
6.83%
7323.9%
[
7.5%
-
8.0%
]
7.95%
1,6226.9%
[
9.0%
-
9.5%
]
9.24%
8668.0%
[
12.0%
-
12.5%
]
12.12%
9572.1%