French 4 or more Vehicles in Household
COMPARE
French
Select to Compare
4 or more Vehicles in Household
French 4 or more Vehicles in Household
6.9%
4+ VEHICLES AVAILABLE
97.7/ 100
METRIC RATING
108th/ 347
METRIC RANK
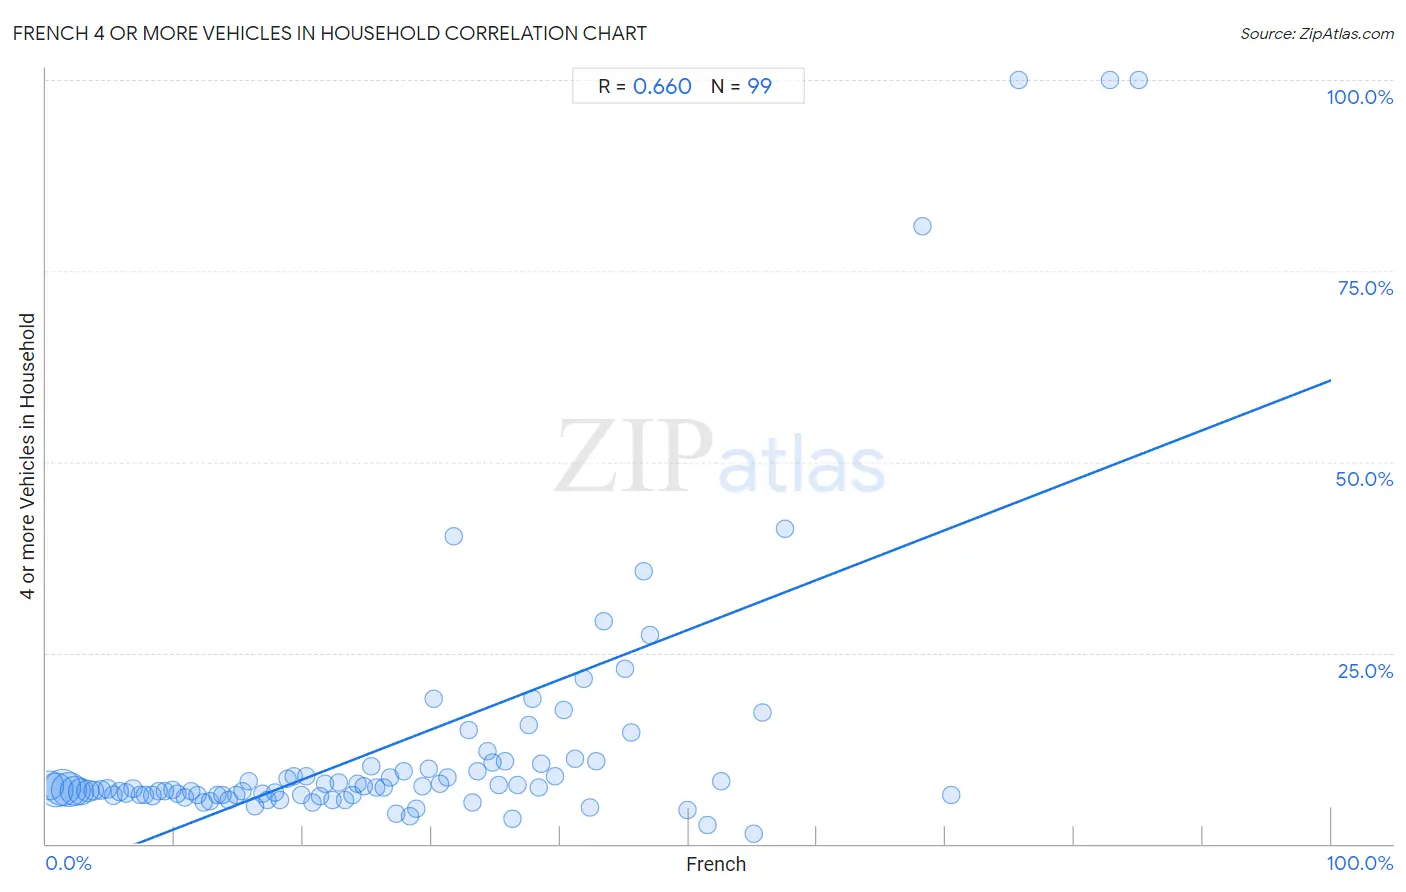
French 4 or more Vehicles in Household Correlation Chart
The statistical analysis conducted on geographies consisting of 568,874,397 people shows a significant positive correlation between the proportion of French and percentage of households with 4 or more vehicles available in the United States with a correlation coefficient (R) of 0.660 and weighted average of 6.9%. On average, for every 1% (one percent) increase in French within a typical geography, there is an increase of 0.65% in percentage of households with 4 or more vehicles available.
It is essential to understand that the correlation between the percentage of French and percentage of households with 4 or more vehicles available does not imply a direct cause-and-effect relationship. It remains uncertain whether the presence of French influences an upward or downward trend in the level of percentage of households with 4 or more vehicles available within an area, or if French simply ended up residing in those areas with higher or lower levels of percentage of households with 4 or more vehicles available due to other factors.
Demographics Similar to French by 4 or more Vehicles in Household
In terms of 4 or more vehicles in household, the demographic groups most similar to French are Filipino (6.9%, a difference of 0.18%), Nicaraguan (7.0%, a difference of 0.34%), Guatemalan (7.0%, a difference of 0.35%), German Russian (7.0%, a difference of 0.69%), and Immigrants from Thailand (6.9%, a difference of 0.69%).
| Demographics | Rating | Rank | 4 or more Vehicles in Household |
| Pakistanis | 98.7 /100 | #101 | Exceptional 7.0% |
| Asians | 98.6 /100 | #102 | Exceptional 7.0% |
| Blackfeet | 98.6 /100 | #103 | Exceptional 7.0% |
| Hmong | 98.3 /100 | #104 | Exceptional 7.0% |
| German Russians | 98.3 /100 | #105 | Exceptional 7.0% |
| Guatemalans | 98.1 /100 | #106 | Exceptional 7.0% |
| Nicaraguans | 98.0 /100 | #107 | Exceptional 7.0% |
| French | 97.7 /100 | #108 | Exceptional 6.9% |
| Filipinos | 97.6 /100 | #109 | Exceptional 6.9% |
| Immigrants from Thailand | 97.0 /100 | #110 | Exceptional 6.9% |
| Aleuts | 97.0 /100 | #111 | Exceptional 6.9% |
| Hopi | 97.0 /100 | #112 | Exceptional 6.9% |
| Canadians | 96.4 /100 | #113 | Exceptional 6.9% |
| Bolivians | 96.3 /100 | #114 | Exceptional 6.8% |
| Tlingit-Haida | 96.2 /100 | #115 | Exceptional 6.8% |
French 4 or more Vehicles in Household Correlation Summary
| Measurement | French Data | 4 or more Vehicles in Household Data |
| Minimum | 0.26% | 1.3% |
| Maximum | 85.0% | 100.0% |
| Range | 84.7% | 98.7% |
| Mean | 27.0% | 13.0% |
| Median | 24.7% | 7.2% |
| Interquartile 25% (IQ1) | 12.3% | 6.4% |
| Interquartile 75% (IQ3) | 37.9% | 10.2% |
| Interquartile Range (IQR) | 25.6% | 3.8% |
| Standard Deviation (Sample) | 18.6% | 18.4% |
| Standard Deviation (Population) | 18.5% | 18.3% |
Correlation Details
| French Percentile | Sample Size | 4 or more Vehicles in Household |
[ 0.0% - 0.5% ] 0.26% | 61,083,428 | 7.6% |
[ 0.5% - 1.0% ] 0.77% | 96,549,198 | 7.1% |
[ 1.0% - 1.5% ] 1.25% | 110,482,372 | 7.3% |
[ 1.5% - 2.0% ] 1.74% | 101,047,207 | 7.1% |
[ 2.0% - 2.5% ] 2.24% | 71,189,735 | 6.9% |
[ 2.5% - 3.0% ] 2.72% | 46,572,878 | 6.8% |
[ 3.0% - 3.5% ] 3.22% | 25,854,986 | 6.9% |
[ 3.5% - 4.0% ] 3.72% | 14,527,603 | 7.0% |
[ 4.0% - 4.5% ] 4.24% | 8,738,975 | 7.0% |
[ 4.5% - 5.0% ] 4.75% | 5,664,255 | 7.2% |
[ 5.0% - 5.5% ] 5.23% | 4,648,010 | 6.4% |
[ 5.5% - 6.0% ] 5.75% | 2,766,857 | 6.8% |
[ 6.0% - 6.5% ] 6.23% | 1,722,585 | 6.7% |
[ 6.5% - 7.0% ] 6.75% | 1,705,055 | 7.2% |
[ 7.0% - 7.5% ] 7.26% | 1,298,918 | 6.4% |
[ 7.5% - 8.0% ] 7.72% | 1,262,984 | 6.3% |
[ 8.0% - 8.5% ] 8.23% | 1,245,413 | 6.3% |
[ 8.5% - 9.0% ] 8.76% | 1,038,383 | 6.8% |
[ 9.0% - 9.5% ] 9.21% | 1,102,320 | 6.9% |
[ 9.5% - 10.0% ] 9.78% | 1,023,010 | 7.0% |
[ 10.0% - 10.5% ] 10.23% | 707,363 | 6.6% |
[ 10.5% - 11.0% ] 10.80% | 1,118,259 | 6.1% |
[ 11.0% - 11.5% ] 11.24% | 438,265 | 6.8% |
[ 11.5% - 12.0% ] 11.75% | 421,918 | 6.5% |
[ 12.0% - 12.5% ] 12.26% | 614,938 | 5.3% |
[ 12.5% - 13.0% ] 12.76% | 592,609 | 5.6% |
[ 13.0% - 13.5% ] 13.29% | 682,167 | 6.4% |
[ 13.5% - 14.0% ] 13.71% | 495,185 | 6.4% |
[ 14.0% - 14.5% ] 14.24% | 569,382 | 5.7% |
[ 14.5% - 15.0% ] 14.76% | 338,258 | 6.4% |
[ 15.0% - 15.5% ] 15.27% | 454,368 | 6.9% |
[ 15.5% - 16.0% ] 15.79% | 321,073 | 8.2% |
[ 16.0% - 16.5% ] 16.24% | 474,189 | 4.9% |
[ 16.5% - 17.0% ] 16.81% | 332,916 | 6.6% |
[ 17.0% - 17.5% ] 17.24% | 167,273 | 5.8% |
[ 17.5% - 18.0% ] 17.78% | 288,456 | 6.7% |
[ 18.0% - 18.5% ] 18.20% | 176,374 | 5.8% |
[ 18.5% - 19.0% ] 18.76% | 61,524 | 8.6% |
[ 19.0% - 19.5% ] 19.25% | 82,308 | 8.9% |
[ 19.5% - 20.0% ] 19.81% | 153,425 | 6.5% |
[ 20.0% - 20.5% ] 20.24% | 55,199 | 8.8% |
[ 20.5% - 21.0% ] 20.73% | 134,353 | 5.4% |
[ 21.0% - 21.5% ] 21.28% | 77,896 | 6.3% |
[ 21.5% - 22.0% ] 21.68% | 69,879 | 7.9% |
[ 22.0% - 22.5% ] 22.28% | 61,387 | 5.7% |
[ 22.5% - 23.0% ] 22.77% | 62,014 | 8.0% |
[ 23.0% - 23.5% ] 23.25% | 89,728 | 5.7% |
[ 23.5% - 24.0% ] 23.79% | 48,004 | 6.3% |
[ 24.0% - 24.5% ] 24.21% | 32,734 | 7.9% |
[ 24.5% - 25.0% ] 24.74% | 17,797 | 7.5% |
[ 25.0% - 25.5% ] 25.30% | 16,576 | 10.2% |
[ 25.5% - 26.0% ] 25.73% | 7,385 | 7.3% |
[ 26.0% - 26.5% ] 26.25% | 20,734 | 7.4% |
[ 26.5% - 27.0% ] 26.73% | 5,922 | 8.7% |
[ 27.0% - 27.5% ] 27.26% | 26,256 | 4.0% |
[ 27.5% - 28.0% ] 27.79% | 20,692 | 9.5% |
[ 28.0% - 28.5% ] 28.28% | 16,003 | 3.7% |
[ 28.5% - 29.0% ] 28.80% | 7,934 | 4.6% |
[ 29.0% - 29.5% ] 29.28% | 20,020 | 7.5% |
[ 29.5% - 30.0% ] 29.72% | 8,547 | 9.7% |
[ 30.0% - 30.5% ] 30.17% | 2,078 | 19.1% |
[ 30.5% - 31.0% ] 30.60% | 5,602 | 7.8% |
[ 31.0% - 31.5% ] 31.24% | 7,078 | 8.7% |
[ 31.5% - 32.0% ] 31.75% | 63 | 40.2% |
[ 32.5% - 33.0% ] 32.85% | 3,656 | 14.9% |
[ 33.0% - 33.5% ] 33.18% | 3,879 | 5.4% |
[ 33.5% - 34.0% ] 33.61% | 854 | 9.5% |
[ 34.0% - 34.5% ] 34.34% | 1,488 | 12.0% |
[ 34.5% - 35.0% ] 34.74% | 2,320 | 10.6% |
[ 35.0% - 35.5% ] 35.22% | 1,661 | 7.7% |
[ 35.5% - 36.0% ] 35.73% | 1,198 | 10.8% |
[ 36.0% - 36.5% ] 36.31% | 2,418 | 3.2% |
[ 36.5% - 37.0% ] 36.70% | 4,741 | 7.7% |
[ 37.0% - 37.5% ] 37.50% | 3,208 | 15.6% |
[ 37.5% - 38.0% ] 37.87% | 375 | 19.0% |
[ 38.0% - 38.5% ] 38.29% | 5,072 | 7.4% |
[ 38.5% - 39.0% ] 38.56% | 1,268 | 10.5% |
[ 39.5% - 40.0% ] 39.63% | 757 | 8.9% |
[ 40.0% - 40.5% ] 40.32% | 888 | 17.5% |
[ 41.0% - 41.5% ] 41.14% | 1,490 | 11.2% |
[ 41.5% - 42.0% ] 41.78% | 1,290 | 21.6% |
[ 42.0% - 42.5% ] 42.33% | 626 | 4.8% |
[ 42.5% - 43.0% ] 42.76% | 1,527 | 10.8% |
[ 43.0% - 43.5% ] 43.41% | 949 | 29.1% |
[ 45.0% - 45.5% ] 45.03% | 795 | 23.0% |
[ 45.5% - 46.0% ] 45.54% | 303 | 14.5% |
[ 46.5% - 47.0% ] 46.51% | 43 | 35.7% |
[ 47.0% - 47.5% ] 47.01% | 134 | 27.3% |
[ 49.5% - 50.0% ] 49.90% | 497 | 4.5% |
[ 51.0% - 51.5% ] 51.42% | 1,474 | 2.5% |
[ 52.5% - 53.0% ] 52.51% | 219 | 8.2% |
[ 55.0% - 55.5% ] 55.05% | 218 | 1.3% |
[ 55.5% - 56.0% ] 55.77% | 1,854 | 17.2% |
[ 57.0% - 57.5% ] 57.50% | 40 | 41.2% |
[ 68.0% - 68.5% ] 68.20% | 239 | 80.8% |
[ 70.0% - 70.5% ] 70.45% | 335 | 6.3% |
[ 75.5% - 76.0% ] 75.71% | 70 | 100.0% |
[ 82.5% - 83.0% ] 82.74% | 168 | 100.0% |
[ 85.0% - 85.5% ] 85.00% | 40 | 100.0% |