Immigrants from South Africa 4 or more Vehicles in Household

COMPARE

Immigrants from South Africa
Race
Ancestry
AfghanAfricanAlaska NativeAlaskan AthabascanAlbanianAleutAlsatianAmericanApacheArabArapahoArgentineanArmenianAssyrian/Chaldean/SyriacAustralianAustrianBahamianBangladeshiBarbadianBasqueBelgianBelizeanBermudanBhutaneseBlackfeetBolivianBrazilianBritishBritish West IndianBulgarianBurmeseCajunCambodianCanadianCape VerdeanCarpatho RusynCelticCentral AmericanCentral American IndianCherokeeCheyenneChickasawChileanChineseChippewaChoctawColombianColvilleComancheCosta RicanCreeCreekCroatianCrowCubanCypriotCzechCzechoslovakianDanishDelawareDominicanDutchDutch West IndianEastern EuropeanEcuadorianEgyptianEnglishEstonianEthiopianEuropeanFijianFilipinoFinnishFrenchFrench American IndianFrench CanadianGermanGerman RussianGhanaianGreekGuamanian/ChamorroGuatemalanGuyaneseHaitianHmongHonduranHopiHoumaHungarianIcelanderIndian (Asian)IndonesianInupiatIranianIraqiIrishIroquoisIsraeliItalianJamaicanJapaneseJordanianKenyanKiowaKoreanLaotianLatvianLebaneseLiberianLithuanianLumbeeLuxembourgerMacedonianMalaysianMalteseMarshalleseMenomineeMexicanMexican American IndianMongolianMoroccanNative HawaiianNavajoNepaleseNew ZealanderNicaraguanNigerianNorthern EuropeanNorwegianOkinawanOsageOttawaPaiutePakistaniPalestinianPanamanianParaguayanPennsylvania GermanPeruvianPimaPolishPortuguesePotawatomiPuebloPuerto RicanPuget Sound SalishRomanianRussianSalvadoranSamoanScandinavianScotch-IrishScottishSeminoleSenegaleseSerbianShoshoneSierra LeoneanSiouxSlavicSlovakSloveneSomaliSouth AfricanSouth AmericanSouth American IndianSoviet UnionSpaniardSpanishSpanish AmericanSpanish American IndianSri LankanSubsaharan AfricanSudaneseSwedishSwissSyrianTaiwaneseThaiTlingit-HaidaTohono O'OdhamTonganTrinidadian and TobagonianTsimshianTurkishU.S. Virgin IslanderUgandanUkrainianUruguayanUteVenezuelanVietnameseWelshWest IndianYakamaYaquiYugoslavianYumanYup'ikZimbabwean
Immigration
NonimmigrantsImmigrantsAfghanistanAfricaAlbaniaArgentinaArmeniaAsiaAustraliaAustriaBahamasBangladeshBarbadosBelarusBelgiumBelizeBoliviaBosnia and HerzegovinaBrazilBulgariaBurma/MyanmarCabo VerdeCambodiaCameroonCanadaCaribbeanCentral AmericaChileChinaColombiaCongoCosta RicaCroatiaCubaCzechoslovakiaDenmarkDominicaDominican RepublicEastern AfricaEastern AsiaEastern EuropeEcuadorEgyptEl SalvadorEnglandEritreaEthiopiaEuropeFijiFranceGermanyGhanaGreeceGrenadaGuatemalaGuyanaHaitiHondurasHong KongHungaryIndiaIndonesiaIranIraqIrelandIsraelItalyJamaicaJapanJordanKazakhstanKenyaKoreaKuwaitLaosLatin AmericaLatviaLebanonLiberiaLithuaniaMalaysiaMexicoMicronesiaMiddle AfricaMoldovaMoroccoNepalNetherlandsNicaraguaNigeriaNorth AmericaNorth MacedoniaNorthern AfricaNorthern EuropeNorwayOceaniaPakistanPanamaPeruPhilippinesPolandPortugalRomaniaRussiaSaudi ArabiaScotlandSenegalSerbiaSierra LeoneSingaporeSomaliaSouth AfricaSouth AmericaSouth Central AsiaSouth Eastern AsiaSouthern EuropeSpainSri LankaSt. Vincent and the GrenadinesSudanSwedenSwitzerlandSyriaTaiwanThailandTrinidad and TobagoTurkeyUgandaUkraineUruguayUzbekistanVenezuelaVietnamWest IndiesWestern AfricaWestern AsiaWestern EuropeYemenZaireZimbabweAzores
Select to Compare
Race
Ancestry
AfghanAfricanAlaska NativeAlaskan AthabascanAlbanianAleutAlsatianAmericanApacheArabArapahoArgentineanArmenianAssyrian/Chaldean/SyriacAustralianAustrianBahamianBangladeshiBarbadianBasqueBelgianBelizeanBermudanBhutaneseBlackfeetBolivianBrazilianBritishBritish West IndianBulgarianBurmeseCajunCambodianCanadianCape VerdeanCarpatho RusynCelticCentral AmericanCentral American IndianCherokeeCheyenneChickasawChileanChineseChippewaChoctawColombianColvilleComancheCosta RicanCreeCreekCroatianCrowCubanCypriotCzechCzechoslovakianDanishDelawareDominicanDutchDutch West IndianEastern EuropeanEcuadorianEgyptianEnglishEstonianEthiopianEuropeanFijianFilipinoFinnishFrenchFrench American IndianFrench CanadianGermanGerman RussianGhanaianGreekGuamanian/ChamorroGuatemalanGuyaneseHaitianHmongHonduranHopiHoumaHungarianIcelanderIndian (Asian)IndonesianInupiatIranianIraqiIrishIroquoisIsraeliItalianJamaicanJapaneseJordanianKenyanKiowaKoreanLaotianLatvianLebaneseLiberianLithuanianLumbeeLuxembourgerMacedonianMalaysianMalteseMarshalleseMenomineeMexicanMexican American IndianMongolianMoroccanNative HawaiianNavajoNepaleseNew ZealanderNicaraguanNigerianNorthern EuropeanNorwegianOkinawanOsageOttawaPaiutePakistaniPalestinianPanamanianParaguayanPennsylvania GermanPeruvianPimaPolishPortuguesePotawatomiPuebloPuerto RicanPuget Sound SalishRomanianRussianSalvadoranSamoanScandinavianScotch-IrishScottishSeminoleSenegaleseSerbianShoshoneSierra LeoneanSiouxSlavicSlovakSloveneSomaliSouth AfricanSouth AmericanSouth American IndianSoviet UnionSpaniardSpanishSpanish AmericanSpanish American IndianSri LankanSubsaharan AfricanSudaneseSwedishSwissSyrianTaiwaneseThaiTlingit-HaidaTohono O'OdhamTonganTrinidadian and TobagonianTsimshianTurkishU.S. Virgin IslanderUgandanUkrainianUruguayanUteVenezuelanVietnameseWelshWest IndianYakamaYaquiYugoslavianYumanYup'ikZimbabwean
Immigration
NonimmigrantsImmigrantsAfghanistanAfricaAlbaniaArgentinaArmeniaAsiaAustraliaAustriaBahamasBangladeshBarbadosBelarusBelgiumBelizeBoliviaBosnia and HerzegovinaBrazilBulgariaBurma/MyanmarCabo VerdeCambodiaCameroonCanadaCaribbeanCentral AmericaChileChinaColombiaCongoCosta RicaCroatiaCubaCzechoslovakiaDenmarkDominicaDominican RepublicEastern AfricaEastern AsiaEastern EuropeEcuadorEgyptEl SalvadorEnglandEritreaEthiopiaEuropeFijiFranceGermanyGhanaGreeceGrenadaGuatemalaGuyanaHaitiHondurasHong KongHungaryIndiaIndonesiaIranIraqIrelandIsraelItalyJamaicaJapanJordanKazakhstanKenyaKoreaKuwaitLaosLatin AmericaLatviaLebanonLiberiaLithuaniaMalaysiaMexicoMicronesiaMiddle AfricaMoldovaMoroccoNepalNetherlandsNicaraguaNigeriaNorth AmericaNorth MacedoniaNorthern AfricaNorthern EuropeNorwayOceaniaPakistanPanamaPeruPhilippinesPolandPortugalRomaniaRussiaSaudi ArabiaScotlandSenegalSerbiaSierra LeoneSingaporeSomaliaSouth AmericaSouth Central AsiaSouth Eastern AsiaSouthern EuropeSpainSri LankaSt. Vincent and the GrenadinesSudanSwedenSwitzerlandSyriaTaiwanThailandTrinidad and TobagoTurkeyUgandaUkraineUruguayUzbekistanVenezuelaVietnamWest IndiesWestern AfricaWestern AsiaWestern EuropeYemenZaireZimbabweAzores
4 or more Vehicles in Household
Income
Poverty
Unemployment
Labor Participation
Family Structure
Vehicle Availability
Education Level
Disability

Immigrants from South Africa 4 or more Vehicles in Household
Fair

6.2%
4+ VEHICLES AVAILABLE
35.4/ 100
METRIC RATING
187th/ 347
METRIC RANK

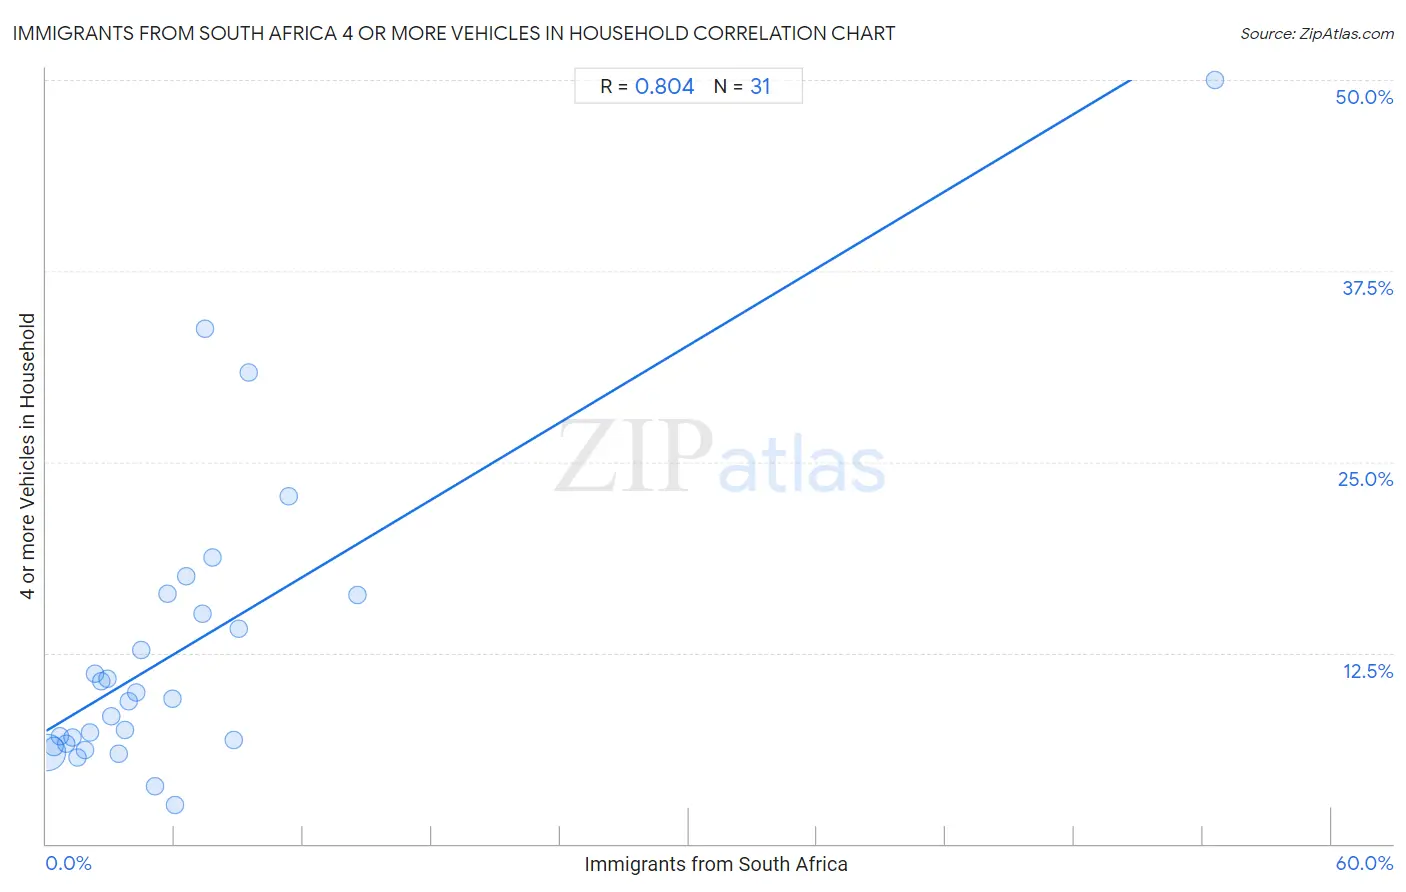
Immigrants from South Africa 4 or more Vehicles in Household Correlation Chart

The statistical analysis conducted on geographies consisting of 232,301,901 people shows a very strong positive correlation between the proportion of Immigrants from South Africa and percentage of households with 4 or more vehicles available in the United States with a correlation coefficient (R) of 0.804 and weighted average of 6.2%. On average, for every 1% (one percent) increase in Immigrants from South Africa within a typical geography, there is an increase of 0.84% in percentage of households with 4 or more vehicles available.
Immigrants from South Africa 4 or more Vehicles in Household
It is essential to understand that the correlation between the percentage of Immigrants from South Africa and percentage of households with 4 or more vehicles available does not imply a direct cause-and-effect relationship. It remains uncertain whether the presence of Immigrants from South Africa influences an upward or downward trend in the level of percentage of households with 4 or more vehicles available within an area, or if Immigrants from South Africa simply ended up residing in those areas with higher or lower levels of percentage of households with 4 or more vehicles available due to other factors.

Demographics Similar to Immigrants from South Africa by 4 or more Vehicles in Household

In terms of 4 or more vehicles in household, the demographic groups most similar to Immigrants from South Africa are Kiowa (6.2%, a difference of 0.070%), Immigrants from Northern Europe (6.2%, a difference of 0.15%), Thai (6.2%, a difference of 0.17%), Iraqi (6.2%, a difference of 0.21%), and Immigrants from Burma/Myanmar (6.2%, a difference of 0.23%).
DemographicsRating | Rank4 or more Vehicles in Household
Syrians
42.0
/100
|
#180
Average
6.3%
Yugoslavians
41.1
/100
|
#181
Average
6.3%
South American Indians
40.7
/100
|
#182
Average
6.3%
Immigrants from Burma/Myanmar
37.5
/100
|
#183
Fair
6.2%
Iraqis
37.3
/100
|
#184
Fair
6.2%
Thais
36.9
/100
|
#185
Fair
6.2%
Immigrants from Northern Europe
36.8
/100
|
#186
Fair
6.2%
Immigrants from South Africa
35.4
/100
|
#187
Fair
6.2%
Kiowa
34.7
/100
|
#188
Fair
6.2%
Immigrants from Eastern Asia
33.3
/100
|
#189
Fair
6.2%
South Africans
32.2
/100
|
#190
Fair
6.2%
Inupiat
30.7
/100
|
#191
Fair
6.2%
Romanians
30.7
/100
|
#192
Fair
6.2%
Immigrants from Kuwait
28.0
/100
|
#193
Fair
6.2%
Immigrants from Sweden
27.0
/100
|
#194
Fair
6.2%

Immigrants from South Africa 4 or more Vehicles in Household Correlation Summary

MeasurementImmigrants from South Africa Data4 or more Vehicles in Household Data
Minimum0.064%2.6%
Maximum54.5%50.0%
Range54.5%47.4%
Mean6.4%12.8%
Median4.2%9.5%
Interquartile 25% (IQ1)2.0%6.6%
Interquartile 75% (IQ3)7.4%16.3%
Interquartile Range (IQR)5.4%9.7%
Standard Deviation (Sample)9.6%10.0%
Standard Deviation (Population)9.4%9.9%

Correlation Details

Immigrants from South Africa PercentileSample Size4 or more Vehicles in Household
[
0.0%
-
0.5%
]
0.064%
219,116,7455.9%
[
0.0%
-
0.5%
]
0.37%
10,178,0946.3%
[
0.5%
-
1.0%
]
0.66%
1,496,8867.0%
[
0.5%
-
1.0%
]
0.94%
777,8236.6%
[
1.0%
-
1.5%
]
1.22%
308,7956.9%
[
1.0%
-
1.5%
]
1.49%
218,3215.6%
[
1.5%
-
2.0%
]
1.79%
28,9726.1%
[
2.0%
-
2.5%
]
2.03%
38,9377.3%
[
2.0%
-
2.5%
]
2.26%
24,41811.1%
[
2.5%
-
3.0%
]
2.58%
17,22810.6%
[
2.5%
-
3.0%
]
2.86%
8,32010.8%
[
3.0%
-
3.5%
]
3.05%
29,6498.4%
[
3.0%
-
3.5%
]
3.37%
3,6155.9%
[
3.5%
-
4.0%
]
3.69%
4,1517.5%
[
3.5%
-
4.0%
]
3.84%
25,8699.3%
[
4.0%
-
4.5%
]
4.20%
3,8599.9%
[
4.0%
-
4.5%
]
4.46%
3,54112.7%
[
5.0%
-
5.5%
]
5.08%
1,3393.8%
[
5.5%
-
6.0%
]
5.65%
1,13216.4%
[
5.5%
-
6.0%
]
5.92%
1529.5%
[
6.0%
-
6.5%
]
6.02%
832.6%
[
6.5%
-
7.0%
]
6.53%
3,90817.5%
[
7.0%
-
7.5%
]
7.31%
5,79015.1%
[
7.0%
-
7.5%
]
7.41%
21633.7%
[
7.5%
-
8.0%
]
7.75%
1,58818.8%
[
8.5%
-
9.0%
]
8.76%
2516.8%
[
9.0%
-
9.5%
]
9.01%
74414.1%
[
9.0%
-
9.5%
]
9.47%
19030.9%
[
11.0%
-
11.5%
]
11.31%
77822.8%
[
14.5%
-
15.0%
]
14.52%
49616.3%
[
54.5%
-
55.0%
]
54.55%
1150.0%