Immigrants from Northern Europe 4 or more Vehicles in Household

COMPARE

Immigrants from Northern Europe
Race
Ancestry
AfghanAfricanAlaska NativeAlaskan AthabascanAlbanianAleutAlsatianAmericanApacheArabArapahoArgentineanArmenianAssyrian/Chaldean/SyriacAustralianAustrianBahamianBangladeshiBarbadianBasqueBelgianBelizeanBermudanBhutaneseBlackfeetBolivianBrazilianBritishBritish West IndianBulgarianBurmeseCajunCambodianCanadianCape VerdeanCarpatho RusynCelticCentral AmericanCentral American IndianCherokeeCheyenneChickasawChileanChineseChippewaChoctawColombianColvilleComancheCosta RicanCreeCreekCroatianCrowCubanCypriotCzechCzechoslovakianDanishDelawareDominicanDutchDutch West IndianEastern EuropeanEcuadorianEgyptianEnglishEstonianEthiopianEuropeanFijianFilipinoFinnishFrenchFrench American IndianFrench CanadianGermanGerman RussianGhanaianGreekGuamanian/ChamorroGuatemalanGuyaneseHaitianHmongHonduranHopiHoumaHungarianIcelanderIndian (Asian)IndonesianInupiatIranianIraqiIrishIroquoisIsraeliItalianJamaicanJapaneseJordanianKenyanKiowaKoreanLaotianLatvianLebaneseLiberianLithuanianLumbeeLuxembourgerMacedonianMalaysianMalteseMarshalleseMenomineeMexicanMexican American IndianMongolianMoroccanNative HawaiianNavajoNepaleseNew ZealanderNicaraguanNigerianNorthern EuropeanNorwegianOkinawanOsageOttawaPaiutePakistaniPalestinianPanamanianParaguayanPennsylvania GermanPeruvianPimaPolishPortuguesePotawatomiPuebloPuerto RicanPuget Sound SalishRomanianRussianSalvadoranSamoanScandinavianScotch-IrishScottishSeminoleSenegaleseSerbianShoshoneSierra LeoneanSiouxSlavicSlovakSloveneSomaliSouth AfricanSouth AmericanSouth American IndianSoviet UnionSpaniardSpanishSpanish AmericanSpanish American IndianSri LankanSubsaharan AfricanSudaneseSwedishSwissSyrianTaiwaneseThaiTlingit-HaidaTohono O'OdhamTonganTrinidadian and TobagonianTsimshianTurkishU.S. Virgin IslanderUgandanUkrainianUruguayanUteVenezuelanVietnameseWelshWest IndianYakamaYaquiYugoslavianYumanYup'ikZimbabwean
Immigration
NonimmigrantsImmigrantsAfghanistanAfricaAlbaniaArgentinaArmeniaAsiaAustraliaAustriaBahamasBangladeshBarbadosBelarusBelgiumBelizeBoliviaBosnia and HerzegovinaBrazilBulgariaBurma/MyanmarCabo VerdeCambodiaCameroonCanadaCaribbeanCentral AmericaChileChinaColombiaCongoCosta RicaCroatiaCubaCzechoslovakiaDenmarkDominicaDominican RepublicEastern AfricaEastern AsiaEastern EuropeEcuadorEgyptEl SalvadorEnglandEritreaEthiopiaEuropeFijiFranceGermanyGhanaGreeceGrenadaGuatemalaGuyanaHaitiHondurasHong KongHungaryIndiaIndonesiaIranIraqIrelandIsraelItalyJamaicaJapanJordanKazakhstanKenyaKoreaKuwaitLaosLatin AmericaLatviaLebanonLiberiaLithuaniaMalaysiaMexicoMicronesiaMiddle AfricaMoldovaMoroccoNepalNetherlandsNicaraguaNigeriaNorth AmericaNorth MacedoniaNorthern AfricaNorthern EuropeNorwayOceaniaPakistanPanamaPeruPhilippinesPolandPortugalRomaniaRussiaSaudi ArabiaScotlandSenegalSerbiaSierra LeoneSingaporeSomaliaSouth AfricaSouth AmericaSouth Central AsiaSouth Eastern AsiaSouthern EuropeSpainSri LankaSt. Vincent and the GrenadinesSudanSwedenSwitzerlandSyriaTaiwanThailandTrinidad and TobagoTurkeyUgandaUkraineUruguayUzbekistanVenezuelaVietnamWest IndiesWestern AfricaWestern AsiaWestern EuropeYemenZaireZimbabweAzores
Select to Compare
Race
Ancestry
AfghanAfricanAlaska NativeAlaskan AthabascanAlbanianAleutAlsatianAmericanApacheArabArapahoArgentineanArmenianAssyrian/Chaldean/SyriacAustralianAustrianBahamianBangladeshiBarbadianBasqueBelgianBelizeanBermudanBhutaneseBlackfeetBolivianBrazilianBritishBritish West IndianBulgarianBurmeseCajunCambodianCanadianCape VerdeanCarpatho RusynCelticCentral AmericanCentral American IndianCherokeeCheyenneChickasawChileanChineseChippewaChoctawColombianColvilleComancheCosta RicanCreeCreekCroatianCrowCubanCypriotCzechCzechoslovakianDanishDelawareDominicanDutchDutch West IndianEastern EuropeanEcuadorianEgyptianEnglishEstonianEthiopianEuropeanFijianFilipinoFinnishFrenchFrench American IndianFrench CanadianGermanGerman RussianGhanaianGreekGuamanian/ChamorroGuatemalanGuyaneseHaitianHmongHonduranHopiHoumaHungarianIcelanderIndian (Asian)IndonesianInupiatIranianIraqiIrishIroquoisIsraeliItalianJamaicanJapaneseJordanianKenyanKiowaKoreanLaotianLatvianLebaneseLiberianLithuanianLumbeeLuxembourgerMacedonianMalaysianMalteseMarshalleseMenomineeMexicanMexican American IndianMongolianMoroccanNative HawaiianNavajoNepaleseNew ZealanderNicaraguanNigerianNorthern EuropeanNorwegianOkinawanOsageOttawaPaiutePakistaniPalestinianPanamanianParaguayanPennsylvania GermanPeruvianPimaPolishPortuguesePotawatomiPuebloPuerto RicanPuget Sound SalishRomanianRussianSalvadoranSamoanScandinavianScotch-IrishScottishSeminoleSenegaleseSerbianShoshoneSierra LeoneanSiouxSlavicSlovakSloveneSomaliSouth AfricanSouth AmericanSouth American IndianSoviet UnionSpaniardSpanishSpanish AmericanSpanish American IndianSri LankanSubsaharan AfricanSudaneseSwedishSwissSyrianTaiwaneseThaiTlingit-HaidaTohono O'OdhamTonganTrinidadian and TobagonianTsimshianTurkishU.S. Virgin IslanderUgandanUkrainianUruguayanUteVenezuelanVietnameseWelshWest IndianYakamaYaquiYugoslavianYumanYup'ikZimbabwean
Immigration
NonimmigrantsImmigrantsAfghanistanAfricaAlbaniaArgentinaArmeniaAsiaAustraliaAustriaBahamasBangladeshBarbadosBelarusBelgiumBelizeBoliviaBosnia and HerzegovinaBrazilBulgariaBurma/MyanmarCabo VerdeCambodiaCameroonCanadaCaribbeanCentral AmericaChileChinaColombiaCongoCosta RicaCroatiaCubaCzechoslovakiaDenmarkDominicaDominican RepublicEastern AfricaEastern AsiaEastern EuropeEcuadorEgyptEl SalvadorEnglandEritreaEthiopiaEuropeFijiFranceGermanyGhanaGreeceGrenadaGuatemalaGuyanaHaitiHondurasHong KongHungaryIndiaIndonesiaIranIraqIrelandIsraelItalyJamaicaJapanJordanKazakhstanKenyaKoreaKuwaitLaosLatin AmericaLatviaLebanonLiberiaLithuaniaMalaysiaMexicoMicronesiaMiddle AfricaMoldovaMoroccoNepalNetherlandsNicaraguaNigeriaNorth AmericaNorth MacedoniaNorthern AfricaNorwayOceaniaPakistanPanamaPeruPhilippinesPolandPortugalRomaniaRussiaSaudi ArabiaScotlandSenegalSerbiaSierra LeoneSingaporeSomaliaSouth AfricaSouth AmericaSouth Central AsiaSouth Eastern AsiaSouthern EuropeSpainSri LankaSt. Vincent and the GrenadinesSudanSwedenSwitzerlandSyriaTaiwanThailandTrinidad and TobagoTurkeyUgandaUkraineUruguayUzbekistanVenezuelaVietnamWest IndiesWestern AfricaWestern AsiaWestern EuropeYemenZaireZimbabweAzores
4 or more Vehicles in Household
Income
Poverty
Unemployment
Labor Participation
Family Structure
Vehicle Availability
Education Level
Disability

Immigrants from Northern Europe 4 or more Vehicles in Household
Fair

6.2%
4+ VEHICLES AVAILABLE
36.8/ 100
METRIC RATING
186th/ 347
METRIC RANK

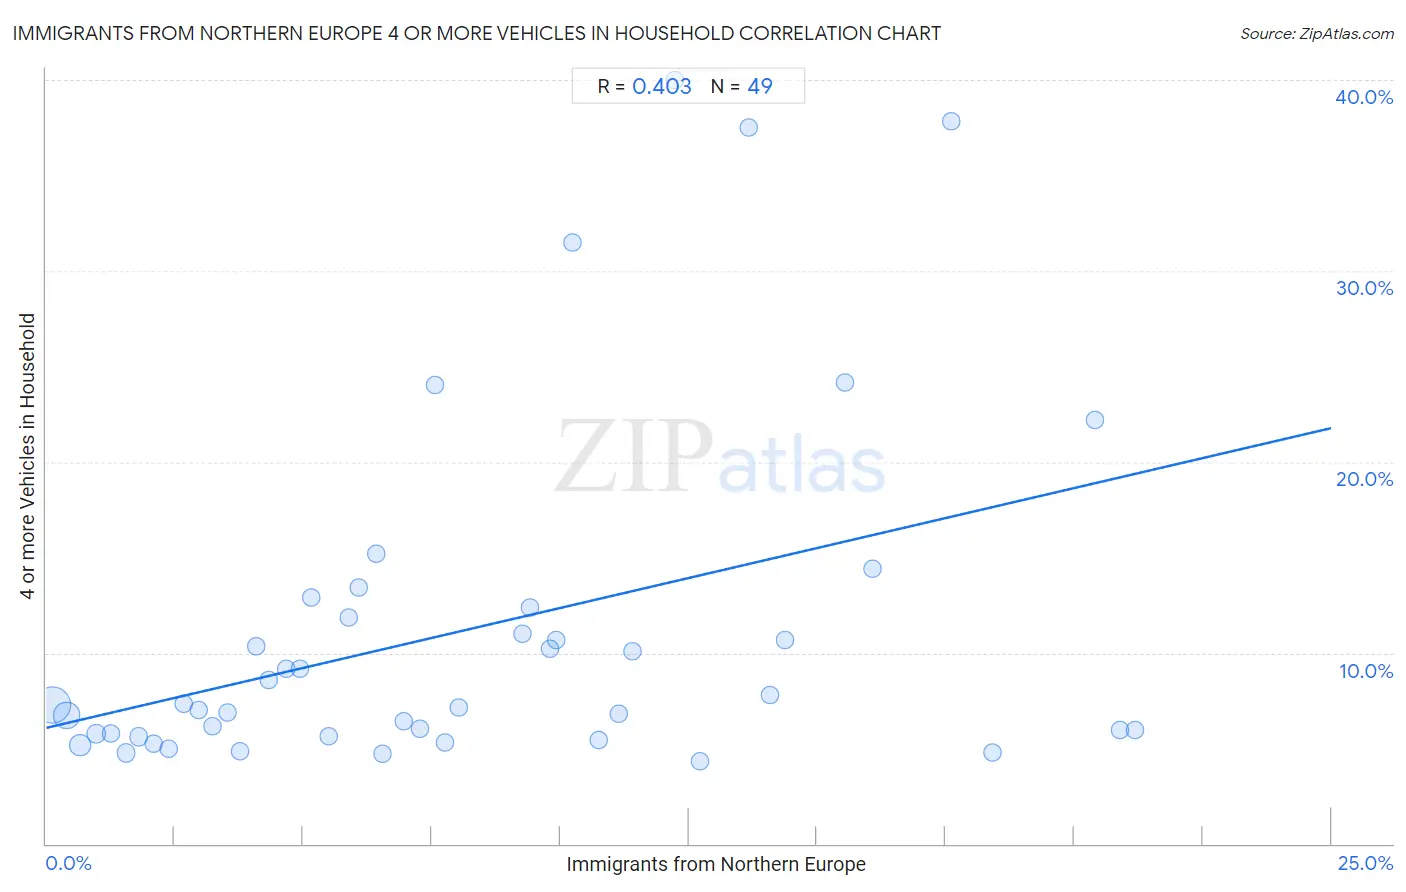
Immigrants from Northern Europe 4 or more Vehicles in Household Correlation Chart

The statistical analysis conducted on geographies consisting of 474,937,091 people shows a moderate positive correlation between the proportion of Immigrants from Northern Europe and percentage of households with 4 or more vehicles available in the United States with a correlation coefficient (R) of 0.403 and weighted average of 6.2%. On average, for every 1% (one percent) increase in Immigrants from Northern Europe within a typical geography, there is an increase of 0.63% in percentage of households with 4 or more vehicles available.
Immigrants from Northern Europe 4 or more Vehicles in Household
It is essential to understand that the correlation between the percentage of Immigrants from Northern Europe and percentage of households with 4 or more vehicles available does not imply a direct cause-and-effect relationship. It remains uncertain whether the presence of Immigrants from Northern Europe influences an upward or downward trend in the level of percentage of households with 4 or more vehicles available within an area, or if Immigrants from Northern Europe simply ended up residing in those areas with higher or lower levels of percentage of households with 4 or more vehicles available due to other factors.

Demographics Similar to Immigrants from Northern Europe by 4 or more Vehicles in Household

In terms of 4 or more vehicles in household, the demographic groups most similar to Immigrants from Northern Europe are Thai (6.2%, a difference of 0.020%), Iraqi (6.2%, a difference of 0.060%), Immigrants from Burma/Myanmar (6.2%, a difference of 0.080%), Immigrants from South Africa (6.2%, a difference of 0.15%), and Kiowa (6.2%, a difference of 0.23%).
DemographicsRating | Rank4 or more Vehicles in Household
Immigrants from Japan
43.1
/100
|
#179
Average
6.3%
Syrians
42.0
/100
|
#180
Average
6.3%
Yugoslavians
41.1
/100
|
#181
Average
6.3%
South American Indians
40.7
/100
|
#182
Average
6.3%
Immigrants from Burma/Myanmar
37.5
/100
|
#183
Fair
6.2%
Iraqis
37.3
/100
|
#184
Fair
6.2%
Thais
36.9
/100
|
#185
Fair
6.2%
Immigrants from Northern Europe
36.8
/100
|
#186
Fair
6.2%
Immigrants from South Africa
35.4
/100
|
#187
Fair
6.2%
Kiowa
34.7
/100
|
#188
Fair
6.2%
Immigrants from Eastern Asia
33.3
/100
|
#189
Fair
6.2%
South Africans
32.2
/100
|
#190
Fair
6.2%
Inupiat
30.7
/100
|
#191
Fair
6.2%
Romanians
30.7
/100
|
#192
Fair
6.2%
Immigrants from Kuwait
28.0
/100
|
#193
Fair
6.2%

Immigrants from Northern Europe 4 or more Vehicles in Household Correlation Summary

MeasurementImmigrants from Northern Europe Data4 or more Vehicles in Household Data
Minimum0.13%4.3%
Maximum21.2%40.0%
Range21.1%35.7%
Mean8.1%11.2%
Median7.0%7.3%
Interquartile 25% (IQ1)3.4%5.7%
Interquartile 75% (IQ3)11.8%12.1%
Interquartile Range (IQR)8.4%6.4%
Standard Deviation (Sample)5.8%9.0%
Standard Deviation (Population)5.7%9.0%

Correlation Details

Immigrants from Northern Europe PercentileSample Size4 or more Vehicles in Household
[
0.0%
-
0.5%
]
0.13%
271,631,1527.3%
[
0.0%
-
0.5%
]
0.40%
115,147,9116.7%
[
0.5%
-
1.0%
]
0.66%
50,241,2255.2%
[
0.5%
-
1.0%
]
0.97%
18,164,3765.8%
[
1.0%
-
1.5%
]
1.26%
8,594,9705.8%
[
1.5%
-
2.0%
]
1.55%
5,083,3414.8%
[
1.5%
-
2.0%
]
1.81%
2,195,2675.6%
[
2.0%
-
2.5%
]
2.08%
1,471,2365.3%
[
2.0%
-
2.5%
]
2.38%
720,2805.0%
[
2.5%
-
3.0%
]
2.68%
406,0907.4%
[
2.5%
-
3.0%
]
2.97%
265,9867.0%
[
3.0%
-
3.5%
]
3.23%
255,0336.1%
[
3.5%
-
4.0%
]
3.52%
203,4886.9%
[
3.5%
-
4.0%
]
3.77%
171,1954.9%
[
4.0%
-
4.5%
]
4.09%
76,45110.4%
[
4.0%
-
4.5%
]
4.34%
74,2208.6%
[
4.5%
-
5.0%
]
4.67%
51,9539.1%
[
4.5%
-
5.0%
]
4.93%
26,2439.2%
[
5.0%
-
5.5%
]
5.16%
23,50712.9%
[
5.0%
-
5.5%
]
5.49%
45,0045.6%
[
5.5%
-
6.0%
]
5.87%
24,03911.9%
[
6.0%
-
6.5%
]
6.07%
2,09313.4%
[
6.0%
-
6.5%
]
6.42%
6,90415.2%
[
6.5%
-
7.0%
]
6.55%
17,7824.7%
[
6.5%
-
7.0%
]
6.97%
11,5976.4%
[
7.0%
-
7.5%
]
7.27%
5,8616.0%
[
7.5%
-
8.0%
]
7.57%
1,50524.1%
[
7.5%
-
8.0%
]
7.76%
2,4625.3%
[
8.0%
-
8.5%
]
8.02%
4,5387.2%
[
9.0%
-
9.5%
]
9.26%
99311.0%
[
9.0%
-
9.5%
]
9.41%
68012.3%
[
9.5%
-
10.0%
]
9.80%
15310.2%
[
9.5%
-
10.0%
]
9.92%
59510.7%
[
10.0%
-
10.5%
]
10.24%
50831.5%
[
10.5%
-
11.0%
]
10.76%
1,1715.4%
[
11.0%
-
11.5%
]
11.14%
2,5406.8%
[
11.0%
-
11.5%
]
11.40%
62310.1%
[
12.0%
-
12.5%
]
12.22%
18040.0%
[
12.5%
-
13.0%
]
12.72%
4564.3%
[
13.5%
-
14.0%
]
13.68%
11737.5%
[
14.0%
-
14.5%
]
14.08%
6257.8%
[
14.0%
-
14.5%
]
14.36%
18810.7%
[
15.5%
-
16.0%
]
15.53%
95324.2%
[
16.0%
-
16.5%
]
16.07%
36114.4%
[
17.5%
-
18.0%
]
17.61%
35237.9%
[
18.0%
-
18.5%
]
18.42%
384.8%
[
20.0%
-
20.5%
]
20.39%
15222.2%
[
20.5%
-
21.0%
]
20.90%
2445.9%
[
21.0%
-
21.5%
]
21.19%
4536.0%