Peruvian 4 or more Vehicles in Household
COMPARE
Peruvian
Select to Compare
4 or more Vehicles in Household
Peruvian 4 or more Vehicles in Household
6.5%
4+ VEHICLES AVAILABLE
69.4/ 100
METRIC RATING
157th/ 347
METRIC RANK
Peruvian 4 or more Vehicles in Household Correlation Chart
The statistical analysis conducted on geographies consisting of 361,410,138 people shows a poor positive correlation between the proportion of Peruvians and percentage of households with 4 or more vehicles available in the United States with a correlation coefficient (R) of 0.161 and weighted average of 6.5%. On average, for every 1% (one percent) increase in Peruvians within a typical geography, there is an increase of 0.13% in percentage of households with 4 or more vehicles available.
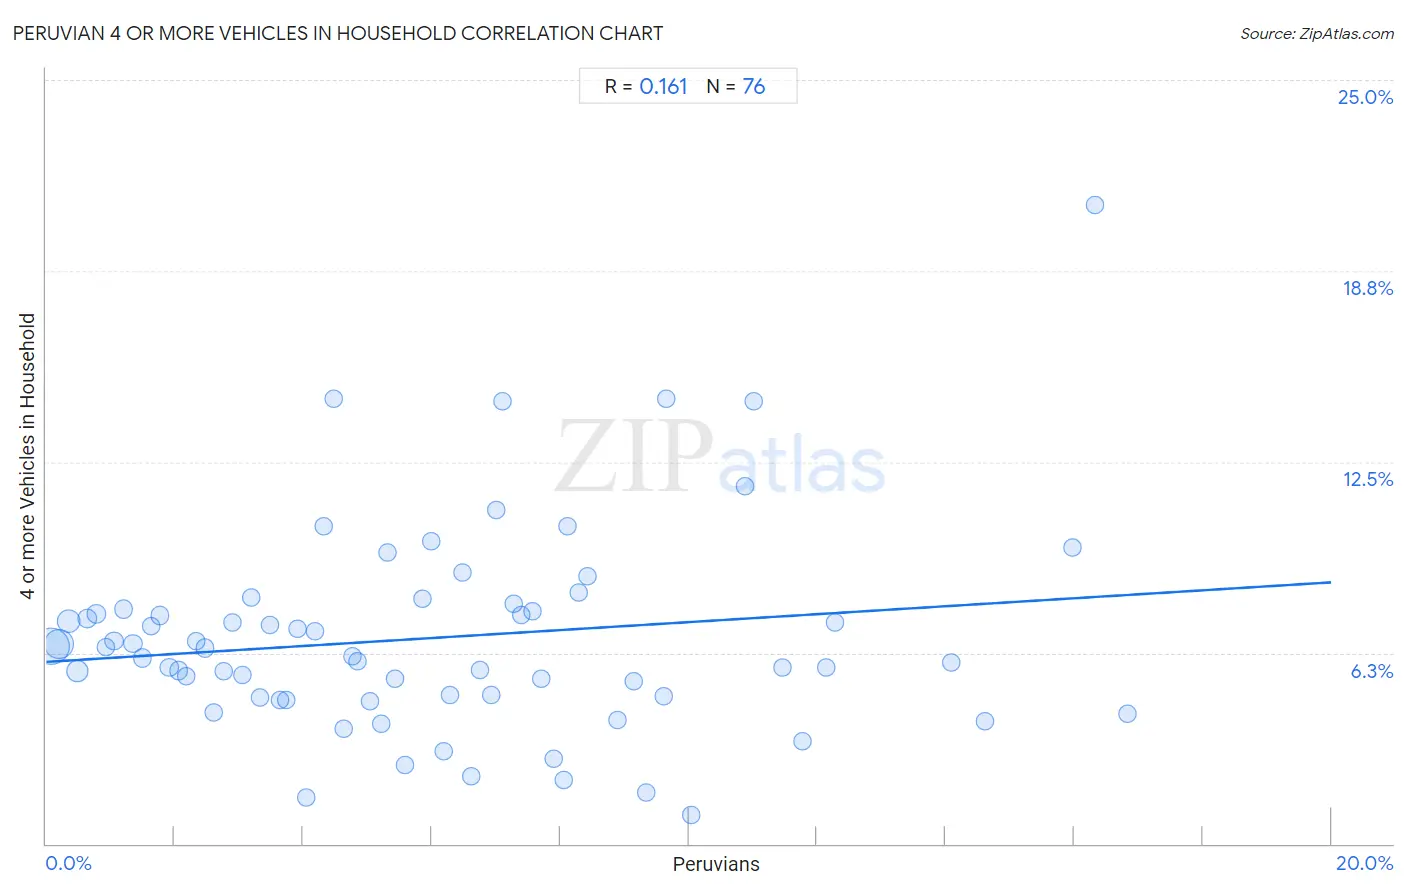
It is essential to understand that the correlation between the percentage of Peruvians and percentage of households with 4 or more vehicles available does not imply a direct cause-and-effect relationship. It remains uncertain whether the presence of Peruvians influences an upward or downward trend in the level of percentage of households with 4 or more vehicles available within an area, or if Peruvians simply ended up residing in those areas with higher or lower levels of percentage of households with 4 or more vehicles available due to other factors.
Demographics Similar to Peruvians by 4 or more Vehicles in Household
In terms of 4 or more vehicles in household, the demographic groups most similar to Peruvians are Iranian (6.5%, a difference of 0.050%), Iroquois (6.5%, a difference of 0.11%), Central American Indian (6.5%, a difference of 0.19%), Immigrants from Armenia (6.5%, a difference of 0.21%), and Zimbabwean (6.4%, a difference of 0.27%).
| Demographics | Rating | Rank | 4 or more Vehicles in Household |
| New Zealanders | 73.3 /100 | #150 | Good 6.5% |
| Immigrants from Hong Kong | 72.2 /100 | #151 | Good 6.5% |
| Yuman | 72.1 /100 | #152 | Good 6.5% |
| Immigrants from Armenia | 71.2 /100 | #153 | Good 6.5% |
| Central American Indians | 71.1 /100 | #154 | Good 6.5% |
| Iroquois | 70.4 /100 | #155 | Good 6.5% |
| Iranians | 69.9 /100 | #156 | Good 6.5% |
| Peruvians | 69.4 /100 | #157 | Good 6.5% |
| Zimbabweans | 67.1 /100 | #158 | Good 6.4% |
| Indians (Asian) | 66.3 /100 | #159 | Good 6.4% |
| Palestinians | 65.8 /100 | #160 | Good 6.4% |
| Immigrants from Cameroon | 64.4 /100 | #161 | Good 6.4% |
| Immigrants from Pakistan | 63.2 /100 | #162 | Good 6.4% |
| Chileans | 61.2 /100 | #163 | Good 6.4% |
| Hungarians | 61.1 /100 | #164 | Good 6.4% |
Peruvian 4 or more Vehicles in Household Correlation Summary
| Measurement | Peruvian Data | 4 or more Vehicles in Household Data |
| Minimum | 0.070% | 0.93% |
| Maximum | 16.8% | 20.9% |
| Range | 16.8% | 20.0% |
| Mean | 6.0% | 6.7% |
| Median | 5.4% | 6.3% |
| Interquartile 25% (IQ1) | 2.7% | 4.8% |
| Interquartile 75% (IQ3) | 8.2% | 7.6% |
| Interquartile Range (IQR) | 5.5% | 2.8% |
| Standard Deviation (Sample) | 4.1% | 3.3% |
| Standard Deviation (Population) | 4.1% | 3.3% |
Correlation Details
| Peruvian Percentile | Sample Size | 4 or more Vehicles in Household |
[ 0.0% - 0.5% ] 0.070% | 148,979,628 | 6.5% |
[ 0.0% - 0.5% ] 0.20% | 85,134,112 | 6.5% |
[ 0.0% - 0.5% ] 0.35% | 40,865,912 | 7.3% |
[ 0.0% - 0.5% ] 0.49% | 31,872,355 | 5.7% |
[ 0.5% - 1.0% ] 0.63% | 13,788,084 | 7.4% |
[ 0.5% - 1.0% ] 0.77% | 8,022,981 | 7.5% |
[ 0.5% - 1.0% ] 0.93% | 5,713,299 | 6.4% |
[ 1.0% - 1.5% ] 1.06% | 4,551,845 | 6.6% |
[ 1.0% - 1.5% ] 1.20% | 3,525,086 | 7.7% |
[ 1.0% - 1.5% ] 1.35% | 2,891,716 | 6.5% |
[ 1.0% - 1.5% ] 1.49% | 1,861,899 | 6.1% |
[ 1.5% - 2.0% ] 1.63% | 1,667,661 | 7.1% |
[ 1.5% - 2.0% ] 1.77% | 1,880,364 | 7.5% |
[ 1.5% - 2.0% ] 1.92% | 1,778,309 | 5.8% |
[ 2.0% - 2.5% ] 2.06% | 995,162 | 5.7% |
[ 2.0% - 2.5% ] 2.18% | 783,237 | 5.5% |
[ 2.0% - 2.5% ] 2.33% | 851,891 | 6.6% |
[ 2.0% - 2.5% ] 2.47% | 845,174 | 6.4% |
[ 2.5% - 3.0% ] 2.60% | 695,821 | 4.3% |
[ 2.5% - 3.0% ] 2.77% | 581,935 | 5.6% |
[ 2.5% - 3.0% ] 2.89% | 324,767 | 7.3% |
[ 3.0% - 3.5% ] 3.05% | 606,728 | 5.5% |
[ 3.0% - 3.5% ] 3.20% | 222,161 | 8.1% |
[ 3.0% - 3.5% ] 3.33% | 421,179 | 4.8% |
[ 3.0% - 3.5% ] 3.49% | 238,569 | 7.1% |
[ 3.5% - 4.0% ] 3.64% | 265,745 | 4.7% |
[ 3.5% - 4.0% ] 3.74% | 247,355 | 4.7% |
[ 3.5% - 4.0% ] 3.92% | 28,885 | 7.1% |
[ 4.0% - 4.5% ] 4.04% | 226,435 | 1.5% |
[ 4.0% - 4.5% ] 4.19% | 83,204 | 7.0% |
[ 4.0% - 4.5% ] 4.32% | 27,211 | 10.4% |
[ 4.0% - 4.5% ] 4.48% | 175,486 | 14.6% |
[ 4.5% - 5.0% ] 4.62% | 217,707 | 3.8% |
[ 4.5% - 5.0% ] 4.76% | 76,854 | 6.2% |
[ 4.5% - 5.0% ] 4.85% | 69,443 | 6.0% |
[ 5.0% - 5.5% ] 5.04% | 98,715 | 4.7% |
[ 5.0% - 5.5% ] 5.22% | 72,562 | 3.9% |
[ 5.0% - 5.5% ] 5.31% | 3,088 | 9.5% |
[ 5.0% - 5.5% ] 5.43% | 72,450 | 5.4% |
[ 5.5% - 6.0% ] 5.58% | 11,743 | 2.6% |
[ 5.5% - 6.0% ] 5.85% | 29,593 | 8.0% |
[ 5.5% - 6.0% ] 5.99% | 10,133 | 9.9% |
[ 6.0% - 6.5% ] 6.19% | 182,097 | 3.0% |
[ 6.0% - 6.5% ] 6.29% | 47,848 | 4.9% |
[ 6.0% - 6.5% ] 6.47% | 11,701 | 8.9% |
[ 6.5% - 7.0% ] 6.61% | 2,815 | 2.2% |
[ 6.5% - 7.0% ] 6.76% | 47,290 | 5.7% |
[ 6.5% - 7.0% ] 6.93% | 9,124 | 4.9% |
[ 7.0% - 7.5% ] 7.00% | 7,212 | 10.9% |
[ 7.0% - 7.5% ] 7.11% | 17,048 | 14.5% |
[ 7.0% - 7.5% ] 7.27% | 4,967 | 7.9% |
[ 7.0% - 7.5% ] 7.40% | 8,945 | 7.5% |
[ 7.5% - 8.0% ] 7.57% | 1,308 | 7.6% |
[ 7.5% - 8.0% ] 7.70% | 40,263 | 5.4% |
[ 7.5% - 8.0% ] 7.89% | 36,545 | 2.8% |
[ 8.0% - 8.5% ] 8.06% | 29,533 | 2.1% |
[ 8.0% - 8.5% ] 8.11% | 4,523 | 10.4% |
[ 8.0% - 8.5% ] 8.29% | 1,231 | 8.2% |
[ 8.0% - 8.5% ] 8.43% | 522 | 8.7% |
[ 8.5% - 9.0% ] 8.89% | 2,463 | 4.0% |
[ 9.0% - 9.5% ] 9.14% | 810 | 5.3% |
[ 9.0% - 9.5% ] 9.34% | 22,377 | 1.7% |
[ 9.5% - 10.0% ] 9.62% | 82,314 | 4.8% |
[ 9.5% - 10.0% ] 9.66% | 1,574 | 14.6% |
[ 10.0% - 10.5% ] 10.03% | 289 | 0.93% |
[ 10.5% - 11.0% ] 10.87% | 276 | 11.7% |
[ 11.0% - 11.5% ] 11.02% | 581 | 14.5% |
[ 11.0% - 11.5% ] 11.46% | 253 | 5.8% |
[ 11.5% - 12.0% ] 11.77% | 11,069 | 3.4% |
[ 12.0% - 12.5% ] 12.13% | 5,778 | 5.7% |
[ 12.0% - 12.5% ] 12.27% | 2,910 | 7.2% |
[ 14.0% - 14.5% ] 14.08% | 6,299 | 5.9% |
[ 14.5% - 15.0% ] 14.60% | 815 | 4.0% |
[ 15.5% - 16.0% ] 15.98% | 1,214 | 9.7% |
[ 16.0% - 16.5% ] 16.33% | 98 | 20.9% |
[ 16.5% - 17.0% ] 16.84% | 1,562 | 4.3% |