Immigrants from Uzbekistan 4 or more Vehicles in Household
COMPARE
Immigrants from Uzbekistan
Select to Compare
4 or more Vehicles in Household
Immigrants from Uzbekistan 4 or more Vehicles in Household
3.6%
4+ VEHICLES AVAILABLE
0.0/ 100
METRIC RATING
339th/ 347
METRIC RANK
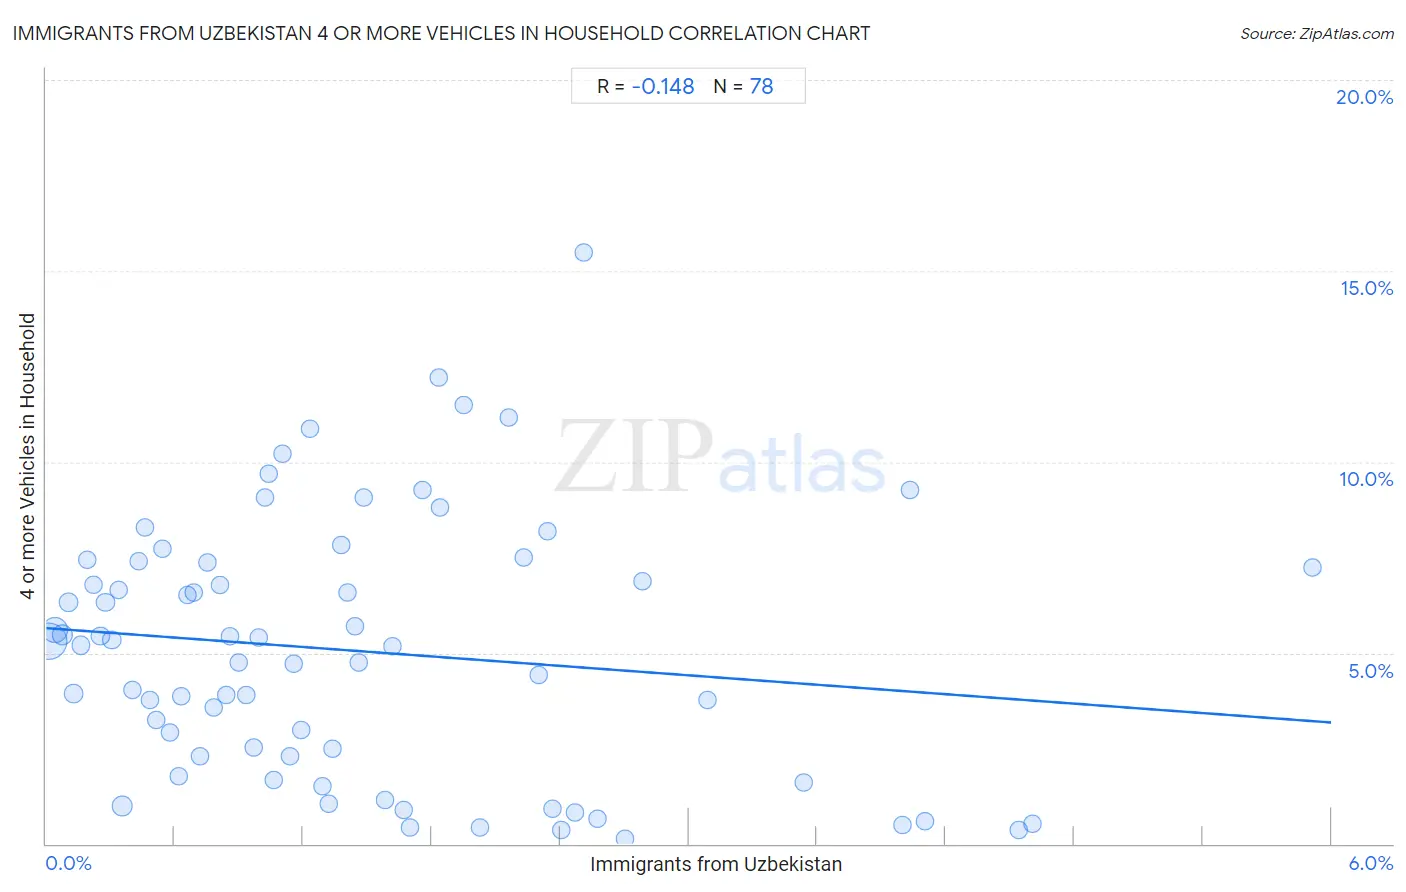
Immigrants from Uzbekistan 4 or more Vehicles in Household Correlation Chart
The statistical analysis conducted on geographies consisting of 118,141,486 people shows a poor negative correlation between the proportion of Immigrants from Uzbekistan and percentage of households with 4 or more vehicles available in the United States with a correlation coefficient (R) of -0.148 and weighted average of 3.6%. On average, for every 1% (one percent) increase in Immigrants from Uzbekistan within a typical geography, there is a decrease of 0.41% in percentage of households with 4 or more vehicles available.
It is essential to understand that the correlation between the percentage of Immigrants from Uzbekistan and percentage of households with 4 or more vehicles available does not imply a direct cause-and-effect relationship. It remains uncertain whether the presence of Immigrants from Uzbekistan influences an upward or downward trend in the level of percentage of households with 4 or more vehicles available within an area, or if Immigrants from Uzbekistan simply ended up residing in those areas with higher or lower levels of percentage of households with 4 or more vehicles available due to other factors.
Demographics Similar to Immigrants from Uzbekistan by 4 or more Vehicles in Household
In terms of 4 or more vehicles in household, the demographic groups most similar to Immigrants from Uzbekistan are Immigrants from Barbados (3.6%, a difference of 0.55%), Dominican (3.5%, a difference of 3.3%), Guyanese (3.5%, a difference of 4.1%), Immigrants from Cabo Verde (3.8%, a difference of 5.0%), and British West Indian (3.5%, a difference of 5.0%).
| Demographics | Rating | Rank | 4 or more Vehicles in Household |
| Immigrants from Dominica | 0.0 /100 | #332 | Tragic 4.2% |
| Immigrants from Albania | 0.0 /100 | #333 | Tragic 4.1% |
| Immigrants from Trinidad and Tobago | 0.0 /100 | #334 | Tragic 4.1% |
| Barbadians | 0.0 /100 | #335 | Tragic 3.9% |
| Immigrants from Bangladesh | 0.0 /100 | #336 | Tragic 3.9% |
| Vietnamese | 0.0 /100 | #337 | Tragic 3.9% |
| Immigrants from Cabo Verde | 0.0 /100 | #338 | Tragic 3.8% |
| Immigrants from Uzbekistan | 0.0 /100 | #339 | Tragic 3.6% |
| Immigrants from Barbados | 0.0 /100 | #340 | Tragic 3.6% |
| Dominicans | 0.0 /100 | #341 | Tragic 3.5% |
| Guyanese | 0.0 /100 | #342 | Tragic 3.5% |
| British West Indians | 0.0 /100 | #343 | Tragic 3.5% |
| Immigrants from Guyana | 0.0 /100 | #344 | Tragic 3.4% |
| Immigrants from Dominican Republic | 0.0 /100 | #345 | Tragic 3.3% |
| Immigrants from St. Vincent and the Grenadines | 0.0 /100 | #346 | Tragic 3.0% |
Immigrants from Uzbekistan 4 or more Vehicles in Household Correlation Summary
| Measurement | Immigrants from Uzbekistan Data | 4 or more Vehicles in Household Data |
| Minimum | 0.011% | 0.15% |
| Maximum | 5.9% | 15.5% |
| Range | 5.9% | 15.3% |
| Mean | 1.5% | 5.0% |
| Median | 1.1% | 5.2% |
| Interquartile 25% (IQ1) | 0.58% | 2.3% |
| Interquartile 75% (IQ3) | 2.0% | 7.4% |
| Interquartile Range (IQR) | 1.4% | 5.1% |
| Standard Deviation (Sample) | 1.2% | 3.4% |
| Standard Deviation (Population) | 1.2% | 3.4% |
Correlation Details
| Immigrants from Uzbekistan Percentile | Sample Size | 4 or more Vehicles in Household |
[ 0.0% - 0.5% ] 0.011% | 55,829,200 | 5.3% |
[ 0.0% - 0.5% ] 0.040% | 22,476,145 | 5.6% |
[ 0.0% - 0.5% ] 0.074% | 8,317,835 | 5.5% |
[ 0.0% - 0.5% ] 0.10% | 4,891,774 | 6.3% |
[ 0.0% - 0.5% ] 0.13% | 4,627,317 | 3.9% |
[ 0.0% - 0.5% ] 0.16% | 2,299,908 | 5.2% |
[ 0.0% - 0.5% ] 0.19% | 1,390,385 | 7.4% |
[ 0.0% - 0.5% ] 0.22% | 1,433,752 | 6.8% |
[ 0.0% - 0.5% ] 0.25% | 1,263,971 | 5.4% |
[ 0.0% - 0.5% ] 0.28% | 901,897 | 6.3% |
[ 0.0% - 0.5% ] 0.31% | 425,857 | 5.3% |
[ 0.0% - 0.5% ] 0.34% | 506,327 | 6.7% |
[ 0.0% - 0.5% ] 0.36% | 9,002,227 | 0.99% |
[ 0.0% - 0.5% ] 0.40% | 363,481 | 4.0% |
[ 0.0% - 0.5% ] 0.43% | 363,231 | 7.4% |
[ 0.0% - 0.5% ] 0.46% | 338,944 | 8.3% |
[ 0.0% - 0.5% ] 0.48% | 281,789 | 3.8% |
[ 0.5% - 1.0% ] 0.51% | 216,747 | 3.3% |
[ 0.5% - 1.0% ] 0.54% | 80,457 | 7.7% |
[ 0.5% - 1.0% ] 0.58% | 220,161 | 2.9% |
[ 0.5% - 1.0% ] 0.62% | 31,481 | 1.8% |
[ 0.5% - 1.0% ] 0.63% | 99,719 | 3.9% |
[ 0.5% - 1.0% ] 0.66% | 140,451 | 6.5% |
[ 0.5% - 1.0% ] 0.69% | 114,951 | 6.6% |
[ 0.5% - 1.0% ] 0.72% | 96,218 | 2.3% |
[ 0.5% - 1.0% ] 0.76% | 226,632 | 7.4% |
[ 0.5% - 1.0% ] 0.78% | 232,772 | 3.6% |
[ 0.5% - 1.0% ] 0.81% | 90,057 | 6.8% |
[ 0.5% - 1.0% ] 0.84% | 56,560 | 3.9% |
[ 0.5% - 1.0% ] 0.86% | 64,140 | 5.4% |
[ 0.5% - 1.0% ] 0.90% | 137,135 | 4.8% |
[ 0.5% - 1.0% ] 0.93% | 92,335 | 3.9% |
[ 0.5% - 1.0% ] 0.97% | 102,693 | 2.5% |
[ 0.5% - 1.0% ] 0.99% | 82,538 | 5.4% |
[ 1.0% - 1.5% ] 1.02% | 51,127 | 9.1% |
[ 1.0% - 1.5% ] 1.04% | 1,350 | 9.7% |
[ 1.0% - 1.5% ] 1.06% | 23,946 | 1.7% |
[ 1.0% - 1.5% ] 1.10% | 40,746 | 10.2% |
[ 1.0% - 1.5% ] 1.14% | 82,462 | 2.3% |
[ 1.0% - 1.5% ] 1.15% | 4,851 | 4.7% |
[ 1.0% - 1.5% ] 1.19% | 61,086 | 3.0% |
[ 1.0% - 1.5% ] 1.23% | 6,333 | 10.9% |
[ 1.0% - 1.5% ] 1.29% | 40,208 | 1.5% |
[ 1.0% - 1.5% ] 1.32% | 47,893 | 1.1% |
[ 1.0% - 1.5% ] 1.34% | 6,570 | 2.5% |
[ 1.0% - 1.5% ] 1.38% | 83,109 | 7.8% |
[ 1.0% - 1.5% ] 1.41% | 427 | 6.6% |
[ 1.0% - 1.5% ] 1.44% | 11,015 | 5.7% |
[ 1.0% - 1.5% ] 1.46% | 1,232 | 4.8% |
[ 1.0% - 1.5% ] 1.48% | 23,244 | 9.1% |
[ 1.5% - 2.0% ] 1.58% | 7,590 | 1.2% |
[ 1.5% - 2.0% ] 1.62% | 13,472 | 5.2% |
[ 1.5% - 2.0% ] 1.67% | 1,017 | 0.87% |
[ 1.5% - 2.0% ] 1.70% | 43,286 | 0.43% |
[ 1.5% - 2.0% ] 1.76% | 6,766 | 9.3% |
[ 1.5% - 2.0% ] 1.83% | 6,115 | 12.2% |
[ 1.5% - 2.0% ] 1.84% | 2,992 | 8.8% |
[ 1.5% - 2.0% ] 1.95% | 6,714 | 11.5% |
[ 2.0% - 2.5% ] 2.02% | 80,575 | 0.41% |
[ 2.0% - 2.5% ] 2.16% | 509 | 11.2% |
[ 2.0% - 2.5% ] 2.23% | 14,291 | 7.5% |
[ 2.0% - 2.5% ] 2.30% | 8,913 | 4.4% |
[ 2.0% - 2.5% ] 2.34% | 641 | 8.2% |
[ 2.0% - 2.5% ] 2.36% | 81,109 | 0.92% |
[ 2.0% - 2.5% ] 2.40% | 90,796 | 0.35% |
[ 2.0% - 2.5% ] 2.47% | 80,113 | 0.83% |
[ 2.5% - 3.0% ] 2.51% | 1,116 | 15.5% |
[ 2.5% - 3.0% ] 2.57% | 20,127 | 0.65% |
[ 2.5% - 3.0% ] 2.70% | 75,212 | 0.15% |
[ 2.5% - 3.0% ] 2.78% | 40,260 | 6.9% |
[ 3.0% - 3.5% ] 3.08% | 33,648 | 3.8% |
[ 3.5% - 4.0% ] 3.54% | 3,136 | 1.6% |
[ 4.0% - 4.5% ] 4.00% | 83,069 | 0.50% |
[ 4.0% - 4.5% ] 4.03% | 1,289 | 9.3% |
[ 4.0% - 4.5% ] 4.10% | 90,245 | 0.60% |
[ 4.5% - 5.0% ] 4.54% | 47,230 | 0.37% |
[ 4.5% - 5.0% ] 4.61% | 13,659 | 0.54% |
[ 5.5% - 6.0% ] 5.91% | 2,910 | 7.2% |