Scottish 4 or more Vehicles in Household
COMPARE
Scottish
Select to Compare
4 or more Vehicles in Household
Scottish 4 or more Vehicles in Household
7.4%
4+ VEHICLES AVAILABLE
99.9/ 100
METRIC RATING
70th/ 347
METRIC RANK
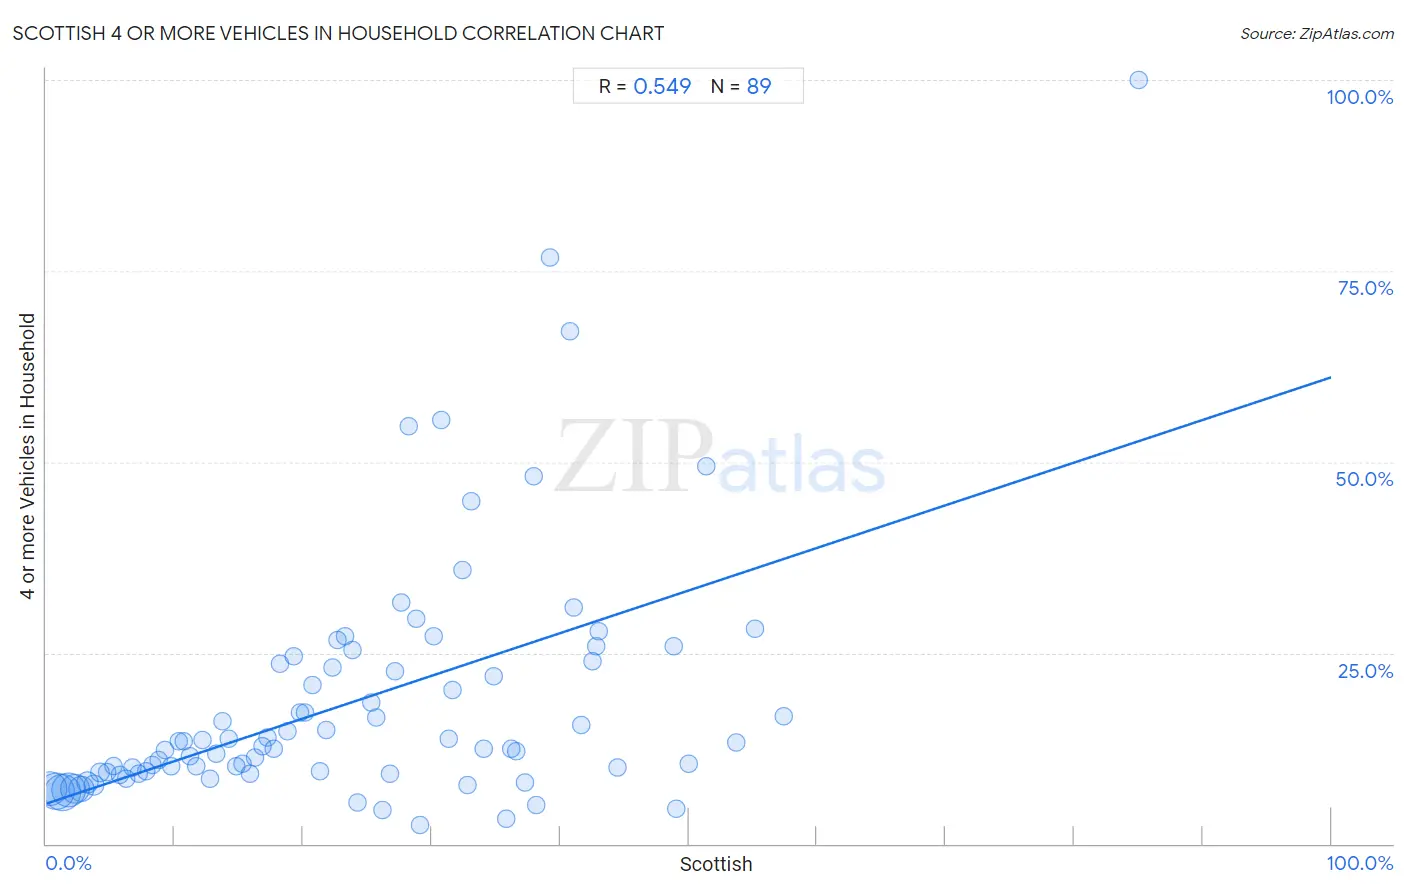
Scottish 4 or more Vehicles in Household Correlation Chart
The statistical analysis conducted on geographies consisting of 563,736,274 people shows a substantial positive correlation between the proportion of Scottish and percentage of households with 4 or more vehicles available in the United States with a correlation coefficient (R) of 0.549 and weighted average of 7.4%. On average, for every 1% (one percent) increase in Scottish within a typical geography, there is an increase of 0.56% in percentage of households with 4 or more vehicles available.
It is essential to understand that the correlation between the percentage of Scottish and percentage of households with 4 or more vehicles available does not imply a direct cause-and-effect relationship. It remains uncertain whether the presence of Scottish influences an upward or downward trend in the level of percentage of households with 4 or more vehicles available within an area, or if Scottish simply ended up residing in those areas with higher or lower levels of percentage of households with 4 or more vehicles available due to other factors.
Demographics Similar to Scottish by 4 or more Vehicles in Household
In terms of 4 or more vehicles in household, the demographic groups most similar to Scottish are German (7.5%, a difference of 0.070%), Chickasaw (7.4%, a difference of 0.13%), Scotch-Irish (7.4%, a difference of 0.43%), Portuguese (7.4%, a difference of 0.52%), and Welsh (7.5%, a difference of 0.67%).
| Demographics | Rating | Rank | 4 or more Vehicles in Household |
| Immigrants from Micronesia | 100.0 /100 | #63 | Exceptional 7.6% |
| Bangladeshis | 100.0 /100 | #64 | Exceptional 7.6% |
| Immigrants from the Azores | 100.0 /100 | #65 | Exceptional 7.5% |
| Immigrants from Taiwan | 99.9 /100 | #66 | Exceptional 7.5% |
| Americans | 99.9 /100 | #67 | Exceptional 7.5% |
| Welsh | 99.9 /100 | #68 | Exceptional 7.5% |
| Germans | 99.9 /100 | #69 | Exceptional 7.5% |
| Scottish | 99.9 /100 | #70 | Exceptional 7.4% |
| Chickasaw | 99.9 /100 | #71 | Exceptional 7.4% |
| Scotch-Irish | 99.9 /100 | #72 | Exceptional 7.4% |
| Portuguese | 99.9 /100 | #73 | Exceptional 7.4% |
| Icelanders | 99.9 /100 | #74 | Exceptional 7.4% |
| Immigrants from Cambodia | 99.9 /100 | #75 | Exceptional 7.4% |
| Laotians | 99.9 /100 | #76 | Exceptional 7.4% |
| Apache | 99.9 /100 | #77 | Exceptional 7.4% |
Scottish 4 or more Vehicles in Household Correlation Summary
| Measurement | Scottish Data | 4 or more Vehicles in Household Data |
| Minimum | 0.27% | 2.5% |
| Maximum | 85.0% | 100.0% |
| Range | 84.7% | 97.5% |
| Mean | 24.1% | 18.7% |
| Median | 22.3% | 12.8% |
| Interquartile 25% (IQ1) | 11.0% | 9.3% |
| Interquartile 75% (IQ3) | 35.3% | 23.8% |
| Interquartile Range (IQR) | 24.3% | 14.5% |
| Standard Deviation (Sample) | 16.1% | 16.4% |
| Standard Deviation (Population) | 16.1% | 16.3% |
Correlation Details
| Scottish Percentile | Sample Size | 4 or more Vehicles in Household |
[ 0.0% - 0.5% ] 0.27% | 94,220,085 | 7.2% |
[ 0.5% - 1.0% ] 0.76% | 107,631,623 | 6.9% |
[ 1.0% - 1.5% ] 1.26% | 107,550,441 | 6.7% |
[ 1.5% - 2.0% ] 1.73% | 94,150,934 | 7.0% |
[ 2.0% - 2.5% ] 2.23% | 64,542,645 | 7.1% |
[ 2.5% - 3.0% ] 2.74% | 41,525,947 | 7.2% |
[ 3.0% - 3.5% ] 3.23% | 22,009,902 | 8.0% |
[ 3.5% - 4.0% ] 3.72% | 12,892,721 | 7.7% |
[ 4.0% - 4.5% ] 4.21% | 7,710,479 | 9.3% |
[ 4.5% - 5.0% ] 4.72% | 4,052,665 | 9.3% |
[ 5.0% - 5.5% ] 5.22% | 2,472,065 | 10.2% |
[ 5.5% - 6.0% ] 5.71% | 1,485,093 | 9.1% |
[ 6.0% - 6.5% ] 6.22% | 858,181 | 8.5% |
[ 6.5% - 7.0% ] 6.72% | 614,667 | 10.0% |
[ 7.0% - 7.5% ] 7.23% | 454,813 | 9.2% |
[ 7.5% - 8.0% ] 7.74% | 282,944 | 9.6% |
[ 8.0% - 8.5% ] 8.23% | 329,119 | 10.3% |
[ 8.5% - 9.0% ] 8.78% | 174,673 | 10.9% |
[ 9.0% - 9.5% ] 9.23% | 128,116 | 12.3% |
[ 9.5% - 10.0% ] 9.73% | 105,912 | 10.1% |
[ 10.0% - 10.5% ] 10.27% | 68,159 | 13.4% |
[ 10.5% - 11.0% ] 10.73% | 88,996 | 13.4% |
[ 11.0% - 11.5% ] 11.21% | 65,685 | 11.5% |
[ 11.5% - 12.0% ] 11.70% | 40,288 | 10.2% |
[ 12.0% - 12.5% ] 12.20% | 46,622 | 13.6% |
[ 12.5% - 13.0% ] 12.70% | 39,190 | 8.5% |
[ 13.0% - 13.5% ] 13.22% | 21,106 | 11.8% |
[ 13.5% - 14.0% ] 13.76% | 13,870 | 16.0% |
[ 14.0% - 14.5% ] 14.22% | 18,387 | 13.8% |
[ 14.5% - 15.0% ] 14.82% | 25,981 | 10.2% |
[ 15.0% - 15.5% ] 15.25% | 8,743 | 10.5% |
[ 15.5% - 16.0% ] 15.82% | 15,989 | 9.2% |
[ 16.0% - 16.5% ] 16.21% | 3,220 | 11.3% |
[ 16.5% - 17.0% ] 16.79% | 3,222 | 12.8% |
[ 17.0% - 17.5% ] 17.21% | 5,491 | 14.0% |
[ 17.5% - 18.0% ] 17.68% | 11,271 | 12.4% |
[ 18.0% - 18.5% ] 18.21% | 6,623 | 23.6% |
[ 18.5% - 19.0% ] 18.74% | 6,643 | 14.8% |
[ 19.0% - 19.5% ] 19.23% | 2,569 | 24.6% |
[ 19.5% - 20.0% ] 19.74% | 8,777 | 17.1% |
[ 20.0% - 20.5% ] 20.18% | 2,165 | 17.1% |
[ 20.5% - 21.0% ] 20.74% | 6,664 | 20.8% |
[ 21.0% - 21.5% ] 21.30% | 1,601 | 9.4% |
[ 21.5% - 22.0% ] 21.82% | 4,491 | 14.9% |
[ 22.0% - 22.5% ] 22.27% | 705 | 23.1% |
[ 22.5% - 23.0% ] 22.67% | 2,602 | 26.7% |
[ 23.0% - 23.5% ] 23.22% | 1,378 | 27.2% |
[ 23.5% - 24.0% ] 23.86% | 2,171 | 25.3% |
[ 24.0% - 24.5% ] 24.26% | 305 | 5.5% |
[ 25.0% - 25.5% ] 25.31% | 2,276 | 18.6% |
[ 25.5% - 26.0% ] 25.73% | 1,714 | 16.5% |
[ 26.0% - 26.5% ] 26.16% | 669 | 4.4% |
[ 26.5% - 27.0% ] 26.71% | 2,175 | 9.1% |
[ 27.0% - 27.5% ] 27.18% | 309 | 22.6% |
[ 27.5% - 28.0% ] 27.65% | 698 | 31.6% |
[ 28.0% - 28.5% ] 28.22% | 1,049 | 54.7% |
[ 28.5% - 29.0% ] 28.76% | 306 | 29.5% |
[ 29.0% - 29.5% ] 29.07% | 767 | 2.5% |
[ 30.0% - 30.5% ] 30.17% | 484 | 27.2% |
[ 30.5% - 31.0% ] 30.77% | 13 | 55.6% |
[ 31.0% - 31.5% ] 31.30% | 1,834 | 13.7% |
[ 31.5% - 32.0% ] 31.64% | 1,005 | 20.1% |
[ 32.0% - 32.5% ] 32.42% | 219 | 35.9% |
[ 32.5% - 33.0% ] 32.79% | 305 | 7.6% |
[ 33.0% - 33.5% ] 33.09% | 278 | 44.8% |
[ 34.0% - 34.5% ] 34.06% | 323 | 12.5% |
[ 34.5% - 35.0% ] 34.81% | 770 | 21.9% |
[ 35.5% - 36.0% ] 35.76% | 151 | 3.3% |
[ 36.0% - 36.5% ] 36.15% | 130 | 12.4% |
[ 36.5% - 37.0% ] 36.56% | 279 | 12.1% |
[ 37.0% - 37.5% ] 37.27% | 322 | 8.0% |
[ 37.5% - 38.0% ] 37.93% | 406 | 48.2% |
[ 38.0% - 38.5% ] 38.17% | 241 | 5.1% |
[ 39.0% - 39.5% ] 39.16% | 143 | 76.8% |
[ 40.5% - 41.0% ] 40.76% | 238 | 67.1% |
[ 41.0% - 41.5% ] 41.06% | 492 | 31.0% |
[ 41.5% - 42.0% ] 41.59% | 226 | 15.6% |
[ 42.0% - 42.5% ] 42.50% | 80 | 23.9% |
[ 42.5% - 43.0% ] 42.77% | 159 | 25.9% |
[ 43.0% - 43.5% ] 43.02% | 172 | 27.8% |
[ 44.0% - 44.5% ] 44.44% | 45 | 10.0% |
[ 48.5% - 49.0% ] 48.87% | 354 | 25.9% |
[ 49.0% - 49.5% ] 49.00% | 451 | 4.5% |
[ 50.0% - 50.5% ] 50.00% | 50 | 10.5% |
[ 51.0% - 51.5% ] 51.38% | 654 | 49.4% |
[ 53.5% - 54.0% ] 53.66% | 41 | 13.3% |
[ 55.0% - 55.5% ] 55.15% | 136 | 28.2% |
[ 57.0% - 57.5% ] 57.40% | 331 | 16.7% |
[ 85.0% - 85.5% ] 85.00% | 40 | 100.0% |