Immigrants from France 4 or more Vehicles in Household
COMPARE
Immigrants from France
Select to Compare
4 or more Vehicles in Household
Immigrants from France 4 or more Vehicles in Household
5.6%
4+ VEHICLES AVAILABLE
1.3/ 100
METRIC RATING
259th/ 347
METRIC RANK
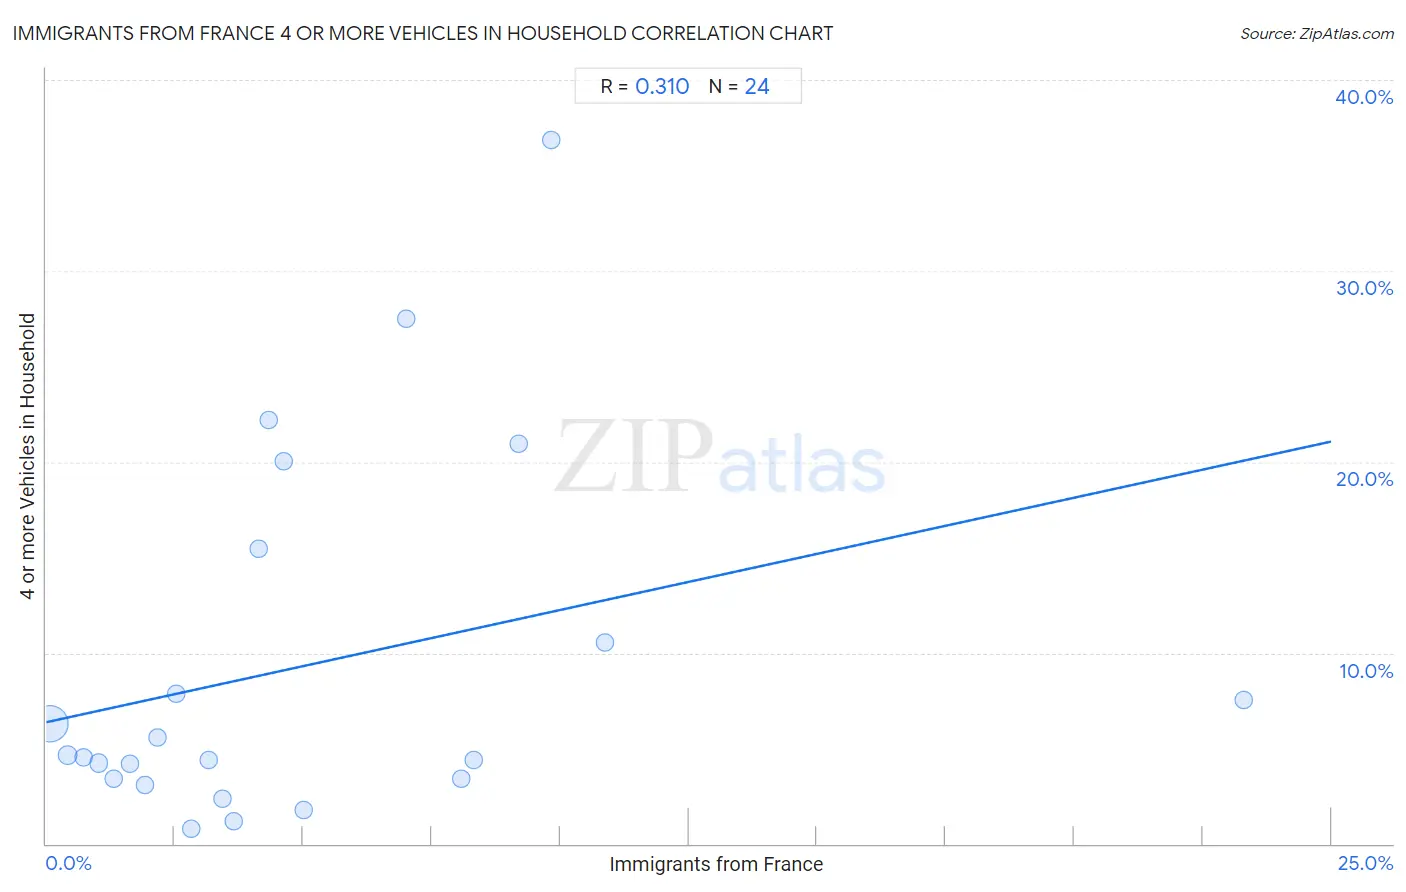
Immigrants from France 4 or more Vehicles in Household Correlation Chart
The statistical analysis conducted on geographies consisting of 286,406,976 people shows a mild positive correlation between the proportion of Immigrants from France and percentage of households with 4 or more vehicles available in the United States with a correlation coefficient (R) of 0.310 and weighted average of 5.6%. On average, for every 1% (one percent) increase in Immigrants from France within a typical geography, there is an increase of 0.59% in percentage of households with 4 or more vehicles available.
It is essential to understand that the correlation between the percentage of Immigrants from France and percentage of households with 4 or more vehicles available does not imply a direct cause-and-effect relationship. It remains uncertain whether the presence of Immigrants from France influences an upward or downward trend in the level of percentage of households with 4 or more vehicles available within an area, or if Immigrants from France simply ended up residing in those areas with higher or lower levels of percentage of households with 4 or more vehicles available due to other factors.
Demographics Similar to Immigrants from France by 4 or more Vehicles in Household
In terms of 4 or more vehicles in household, the demographic groups most similar to Immigrants from France are Immigrants from Lithuania (5.6%, a difference of 0.030%), Immigrants from Northern Africa (5.6%, a difference of 0.17%), Uruguayan (5.6%, a difference of 0.18%), Immigrants from Turkey (5.7%, a difference of 0.25%), and Sudanese (5.6%, a difference of 0.27%).
| Demographics | Rating | Rank | 4 or more Vehicles in Household |
| Sub-Saharan Africans | 2.1 /100 | #252 | Tragic 5.7% |
| Immigrants from Cuba | 1.6 /100 | #253 | Tragic 5.7% |
| Immigrants from Panama | 1.5 /100 | #254 | Tragic 5.7% |
| Yup'ik | 1.5 /100 | #255 | Tragic 5.7% |
| Immigrants from Turkey | 1.5 /100 | #256 | Tragic 5.7% |
| Immigrants from Northern Africa | 1.4 /100 | #257 | Tragic 5.6% |
| Immigrants from Lithuania | 1.4 /100 | #258 | Tragic 5.6% |
| Immigrants from France | 1.3 /100 | #259 | Tragic 5.6% |
| Uruguayans | 1.3 /100 | #260 | Tragic 5.6% |
| Sudanese | 1.2 /100 | #261 | Tragic 5.6% |
| Bermudans | 1.2 /100 | #262 | Tragic 5.6% |
| Immigrants from Saudi Arabia | 1.1 /100 | #263 | Tragic 5.6% |
| Immigrants from Africa | 1.0 /100 | #264 | Tragic 5.6% |
| South Americans | 0.9 /100 | #265 | Tragic 5.6% |
| Immigrants from Nepal | 0.9 /100 | #266 | Tragic 5.6% |
Immigrants from France 4 or more Vehicles in Household Correlation Summary
| Measurement | Immigrants from France Data | 4 or more Vehicles in Household Data |
| Minimum | 0.082% | 0.81% |
| Maximum | 23.3% | 36.8% |
| Range | 23.2% | 36.0% |
| Mean | 5.0% | 9.3% |
| Median | 3.5% | 4.6% |
| Interquartile 25% (IQ1) | 1.8% | 3.4% |
| Interquartile 75% (IQ3) | 7.5% | 13.0% |
| Interquartile Range (IQR) | 5.8% | 9.6% |
| Standard Deviation (Sample) | 5.0% | 9.5% |
| Standard Deviation (Population) | 4.9% | 9.3% |
Correlation Details
| Immigrants from France Percentile | Sample Size | 4 or more Vehicles in Household |
[ 0.0% - 0.5% ] 0.082% | 266,030,014 | 6.3% |
[ 0.0% - 0.5% ] 0.42% | 14,185,094 | 4.7% |
[ 0.5% - 1.0% ] 0.72% | 3,725,874 | 4.5% |
[ 1.0% - 1.5% ] 1.03% | 1,200,083 | 4.2% |
[ 1.0% - 1.5% ] 1.32% | 802,631 | 3.4% |
[ 1.5% - 2.0% ] 1.64% | 274,961 | 4.2% |
[ 1.5% - 2.0% ] 1.91% | 75,677 | 3.1% |
[ 2.0% - 2.5% ] 2.16% | 22,398 | 5.6% |
[ 2.5% - 3.0% ] 2.52% | 13,934 | 7.8% |
[ 2.5% - 3.0% ] 2.82% | 24,227 | 0.81% |
[ 3.0% - 3.5% ] 3.16% | 16,246 | 4.4% |
[ 3.0% - 3.5% ] 3.44% | 11,755 | 2.4% |
[ 3.5% - 4.0% ] 3.64% | 9,386 | 1.1% |
[ 4.0% - 4.5% ] 4.13% | 3,248 | 15.5% |
[ 4.0% - 4.5% ] 4.32% | 880 | 22.2% |
[ 4.5% - 5.0% ] 4.62% | 1,451 | 20.1% |
[ 5.0% - 5.5% ] 5.00% | 6,457 | 1.7% |
[ 7.0% - 7.5% ] 7.00% | 100 | 27.5% |
[ 8.0% - 8.5% ] 8.07% | 322 | 3.4% |
[ 8.0% - 8.5% ] 8.31% | 1,588 | 4.4% |
[ 9.0% - 9.5% ] 9.18% | 98 | 20.9% |
[ 9.5% - 10.0% ] 9.84% | 61 | 36.8% |
[ 10.5% - 11.0% ] 10.87% | 92 | 10.5% |
[ 23.0% - 23.5% ] 23.31% | 399 | 7.5% |