African 4 or more Vehicles in Household
COMPARE
African
Select to Compare
4 or more Vehicles in Household
African 4 or more Vehicles in Household
5.8%
4+ VEHICLES AVAILABLE
4.6/ 100
METRIC RATING
234th/ 347
METRIC RANK
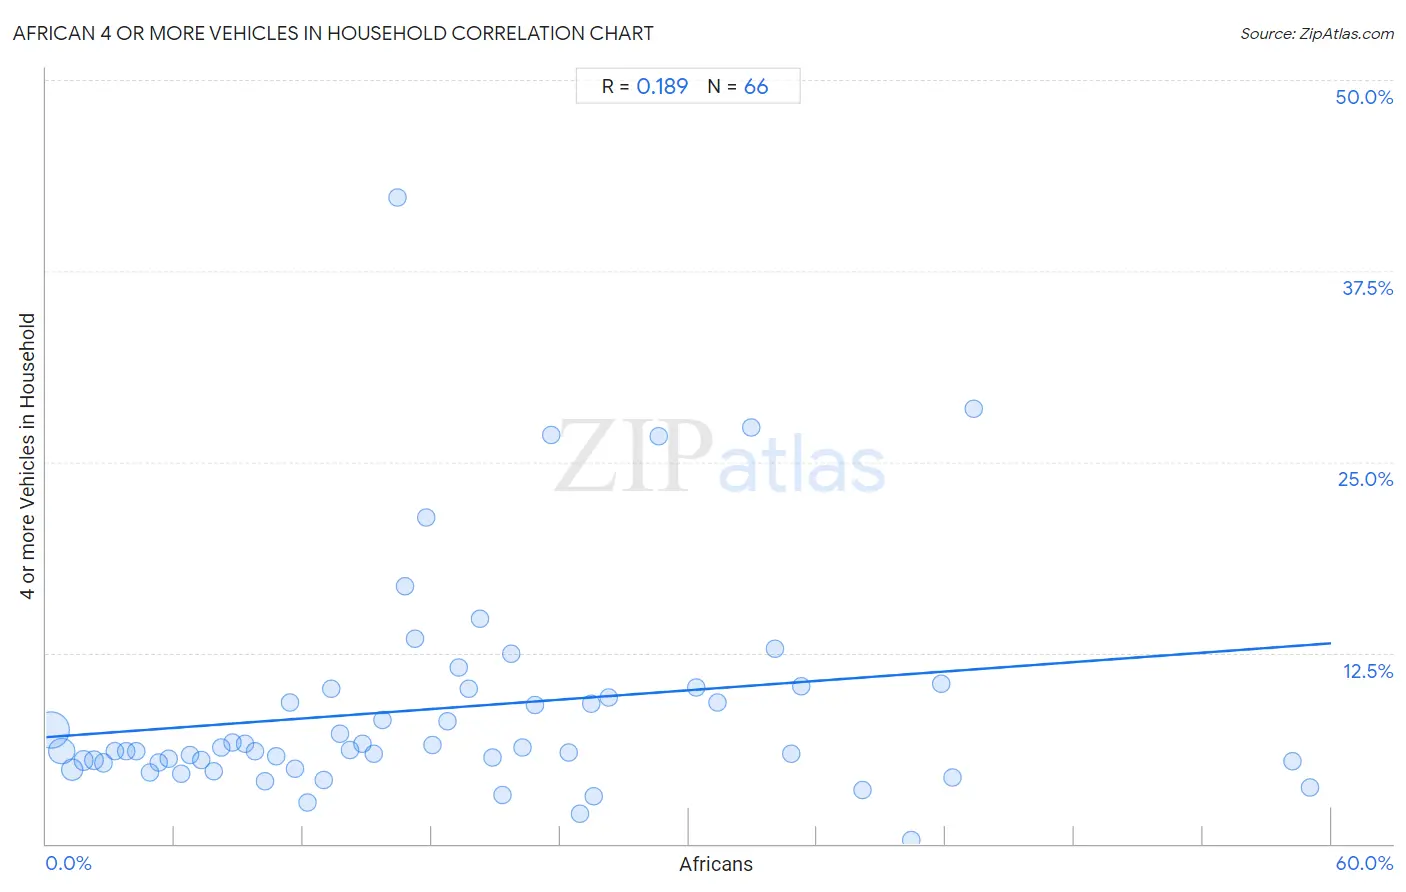
African 4 or more Vehicles in Household Correlation Chart
The statistical analysis conducted on geographies consisting of 467,634,971 people shows a poor positive correlation between the proportion of Africans and percentage of households with 4 or more vehicles available in the United States with a correlation coefficient (R) of 0.189 and weighted average of 5.8%. On average, for every 1% (one percent) increase in Africans within a typical geography, there is an increase of 0.10% in percentage of households with 4 or more vehicles available.
It is essential to understand that the correlation between the percentage of Africans and percentage of households with 4 or more vehicles available does not imply a direct cause-and-effect relationship. It remains uncertain whether the presence of Africans influences an upward or downward trend in the level of percentage of households with 4 or more vehicles available within an area, or if Africans simply ended up residing in those areas with higher or lower levels of percentage of households with 4 or more vehicles available due to other factors.
Demographics Similar to Africans by 4 or more Vehicles in Household
In terms of 4 or more vehicles in household, the demographic groups most similar to Africans are Immigrants from Hungary (5.8%, a difference of 0.020%), Immigrants from Eritrea (5.8%, a difference of 0.030%), Turkish (5.8%, a difference of 0.31%), Immigrants from Belgium (5.8%, a difference of 0.44%), and Immigrants from Australia (5.8%, a difference of 0.53%).
| Demographics | Rating | Rank | 4 or more Vehicles in Household |
| Immigrants from Western Asia | 7.8 /100 | #227 | Tragic 5.9% |
| Immigrants from Uganda | 7.5 /100 | #228 | Tragic 5.9% |
| Eastern Europeans | 6.8 /100 | #229 | Tragic 5.9% |
| Immigrants from Malaysia | 6.7 /100 | #230 | Tragic 5.9% |
| Immigrants from Switzerland | 6.4 /100 | #231 | Tragic 5.9% |
| Immigrants from Argentina | 6.0 /100 | #232 | Tragic 5.9% |
| Sierra Leoneans | 6.0 /100 | #233 | Tragic 5.9% |
| Africans | 4.6 /100 | #234 | Tragic 5.8% |
| Immigrants from Hungary | 4.6 /100 | #235 | Tragic 5.8% |
| Immigrants from Eritrea | 4.5 /100 | #236 | Tragic 5.8% |
| Turks | 4.1 /100 | #237 | Tragic 5.8% |
| Immigrants from Belgium | 4.0 /100 | #238 | Tragic 5.8% |
| Immigrants from Australia | 3.8 /100 | #239 | Tragic 5.8% |
| Immigrants from Poland | 3.8 /100 | #240 | Tragic 5.8% |
| Mongolians | 3.7 /100 | #241 | Tragic 5.8% |
African 4 or more Vehicles in Household Correlation Summary
| Measurement | African Data | 4 or more Vehicles in Household Data |
| Minimum | 0.21% | 0.25% |
| Maximum | 59.0% | 42.3% |
| Range | 58.8% | 42.1% |
| Mean | 18.6% | 8.9% |
| Median | 16.6% | 6.1% |
| Interquartile 25% (IQ1) | 8.2% | 5.4% |
| Interquartile 75% (IQ3) | 25.5% | 10.2% |
| Interquartile Range (IQR) | 17.3% | 4.8% |
| Standard Deviation (Sample) | 13.4% | 7.3% |
| Standard Deviation (Population) | 13.3% | 7.2% |
Correlation Details
| African Percentile | Sample Size | 4 or more Vehicles in Household |
[ 0.0% - 0.5% ] 0.21% | 252,531,278 | 7.4% |
[ 0.5% - 1.0% ] 0.72% | 105,267,440 | 6.1% |
[ 1.0% - 1.5% ] 1.21% | 58,116,134 | 4.9% |
[ 1.5% - 2.0% ] 1.72% | 20,892,867 | 5.5% |
[ 2.0% - 2.5% ] 2.23% | 10,556,876 | 5.5% |
[ 2.5% - 3.0% ] 2.68% | 7,814,926 | 5.3% |
[ 3.0% - 3.5% ] 3.20% | 4,223,788 | 6.1% |
[ 3.5% - 4.0% ] 3.71% | 1,821,866 | 6.1% |
[ 4.0% - 4.5% ] 4.22% | 1,244,648 | 6.1% |
[ 4.5% - 5.0% ] 4.83% | 1,260,630 | 4.7% |
[ 5.0% - 5.5% ] 5.25% | 774,862 | 5.4% |
[ 5.5% - 6.0% ] 5.71% | 449,730 | 5.5% |
[ 6.0% - 6.5% ] 6.31% | 383,782 | 4.6% |
[ 6.5% - 7.0% ] 6.70% | 492,744 | 5.8% |
[ 7.0% - 7.5% ] 7.25% | 285,750 | 5.5% |
[ 7.5% - 8.0% ] 7.83% | 199,834 | 4.7% |
[ 8.0% - 8.5% ] 8.19% | 159,283 | 6.3% |
[ 8.5% - 9.0% ] 8.70% | 154,033 | 6.7% |
[ 9.0% - 9.5% ] 9.27% | 163,699 | 6.6% |
[ 9.5% - 10.0% ] 9.74% | 65,240 | 6.1% |
[ 10.0% - 10.5% ] 10.22% | 133,946 | 4.1% |
[ 10.5% - 11.0% ] 10.72% | 229,540 | 5.8% |
[ 11.0% - 11.5% ] 11.36% | 8,958 | 9.2% |
[ 11.5% - 12.0% ] 11.63% | 24,644 | 4.9% |
[ 12.0% - 12.5% ] 12.23% | 12,515 | 2.7% |
[ 12.5% - 13.0% ] 12.93% | 23,227 | 4.2% |
[ 13.0% - 13.5% ] 13.31% | 4,891 | 10.2% |
[ 13.5% - 14.0% ] 13.70% | 4,393 | 7.2% |
[ 14.0% - 14.5% ] 14.17% | 15,888 | 6.1% |
[ 14.5% - 15.0% ] 14.77% | 102,089 | 6.6% |
[ 15.0% - 15.5% ] 15.29% | 21,887 | 5.9% |
[ 15.5% - 16.0% ] 15.72% | 8,427 | 8.1% |
[ 16.0% - 16.5% ] 16.42% | 67 | 42.3% |
[ 16.5% - 17.0% ] 16.77% | 6,655 | 16.8% |
[ 17.0% - 17.5% ] 17.21% | 16,222 | 13.4% |
[ 17.5% - 18.0% ] 17.74% | 2,672 | 21.4% |
[ 18.0% - 18.5% ] 18.05% | 35,992 | 6.5% |
[ 18.5% - 19.0% ] 18.74% | 19,765 | 8.0% |
[ 19.0% - 19.5% ] 19.26% | 488 | 11.5% |
[ 19.5% - 20.0% ] 19.75% | 13,325 | 10.2% |
[ 20.0% - 20.5% ] 20.25% | 2,929 | 14.8% |
[ 20.5% - 21.0% ] 20.81% | 2,849 | 5.6% |
[ 21.0% - 21.5% ] 21.32% | 15,443 | 3.2% |
[ 21.5% - 22.0% ] 21.71% | 6,846 | 12.4% |
[ 22.0% - 22.5% ] 22.26% | 283 | 6.3% |
[ 22.5% - 23.0% ] 22.80% | 9,501 | 9.1% |
[ 23.5% - 24.0% ] 23.56% | 365 | 26.8% |
[ 24.0% - 24.5% ] 24.38% | 24,985 | 5.9% |
[ 24.5% - 25.0% ] 24.91% | 273 | 2.0% |
[ 25.0% - 25.5% ] 25.47% | 267 | 9.2% |
[ 25.5% - 26.0% ] 25.54% | 881 | 3.1% |
[ 26.0% - 26.5% ] 26.24% | 2,069 | 9.6% |
[ 28.5% - 29.0% ] 28.57% | 154 | 26.7% |
[ 30.0% - 30.5% ] 30.36% | 606 | 10.2% |
[ 31.0% - 31.5% ] 31.35% | 2,485 | 9.3% |
[ 32.5% - 33.0% ] 32.93% | 334 | 27.3% |
[ 34.0% - 34.5% ] 34.01% | 1,476 | 12.8% |
[ 34.5% - 35.0% ] 34.78% | 46 | 5.9% |
[ 35.0% - 35.5% ] 35.23% | 1,286 | 10.3% |
[ 38.0% - 38.5% ] 38.10% | 4,572 | 3.6% |
[ 40.0% - 40.5% ] 40.41% | 9,613 | 0.25% |
[ 41.5% - 42.0% ] 41.76% | 613 | 10.4% |
[ 42.0% - 42.5% ] 42.31% | 338 | 4.3% |
[ 43.0% - 43.5% ] 43.29% | 633 | 28.5% |
[ 58.0% - 58.5% ] 58.19% | 574 | 5.4% |
[ 59.0% - 59.5% ] 59.02% | 549 | 3.7% |