Asian 4 or more Vehicles in Household
COMPARE
Asian
Select to Compare
4 or more Vehicles in Household
Asian 4 or more Vehicles in Household
7.0%
4+ VEHICLES AVAILABLE
98.6/ 100
METRIC RATING
102nd/ 347
METRIC RANK
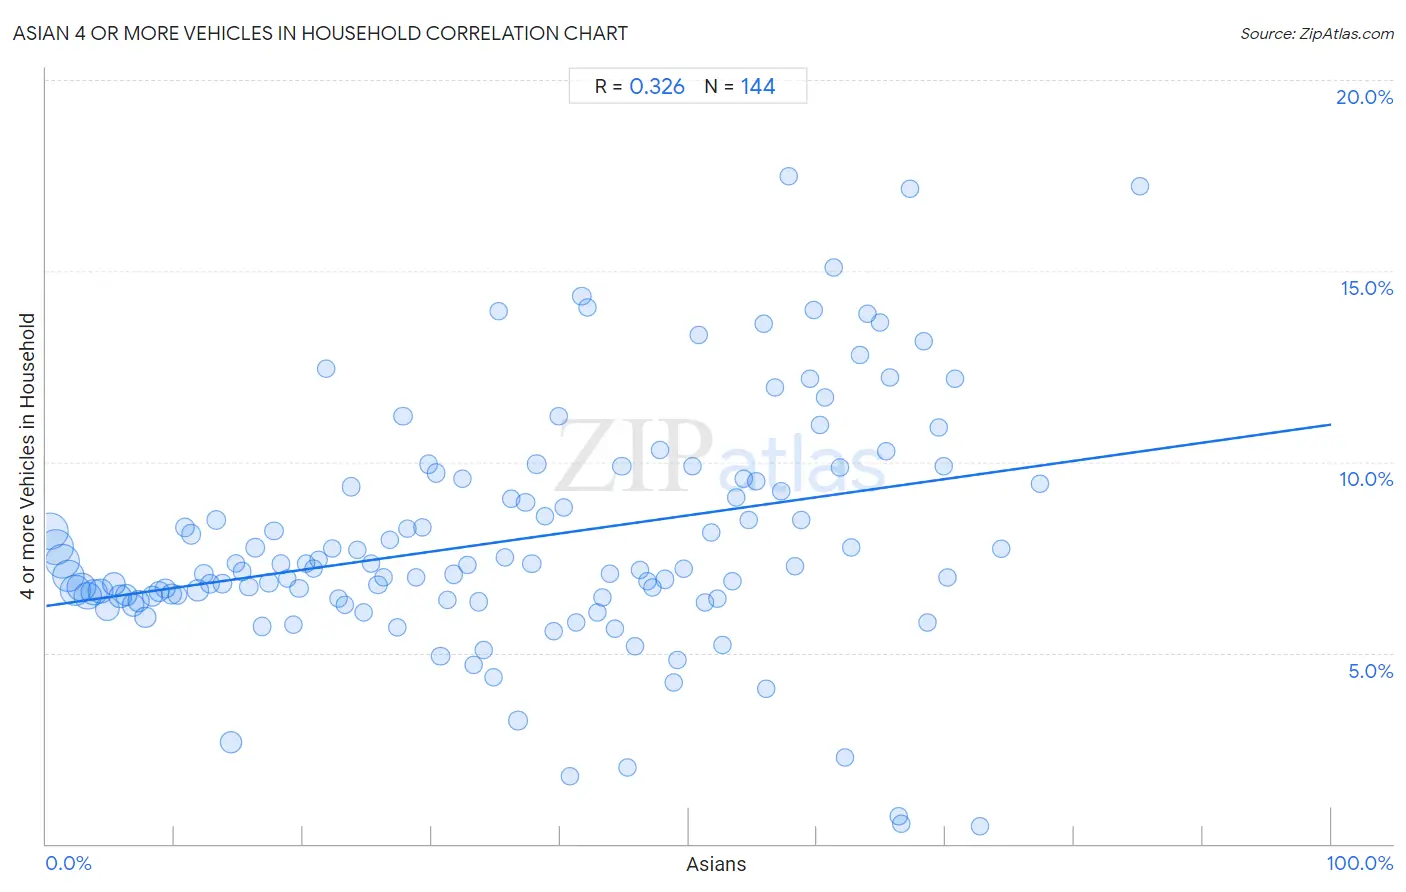
Asian 4 or more Vehicles in Household Correlation Chart
The statistical analysis conducted on geographies consisting of 547,642,894 people shows a mild positive correlation between the proportion of Asians and percentage of households with 4 or more vehicles available in the United States with a correlation coefficient (R) of 0.326 and weighted average of 7.0%. On average, for every 1% (one percent) increase in Asians within a typical geography, there is an increase of 0.048% in percentage of households with 4 or more vehicles available.
It is essential to understand that the correlation between the percentage of Asians and percentage of households with 4 or more vehicles available does not imply a direct cause-and-effect relationship. It remains uncertain whether the presence of Asians influences an upward or downward trend in the level of percentage of households with 4 or more vehicles available within an area, or if Asians simply ended up residing in those areas with higher or lower levels of percentage of households with 4 or more vehicles available due to other factors.
Demographics Similar to Asians by 4 or more Vehicles in Household
In terms of 4 or more vehicles in household, the demographic groups most similar to Asians are Blackfeet (7.0%, a difference of 0.010%), Pakistani (7.0%, a difference of 0.070%), Taiwanese (7.0%, a difference of 0.14%), Seminole (7.0%, a difference of 0.21%), and Hmong (7.0%, a difference of 0.49%).
| Demographics | Rating | Rank | 4 or more Vehicles in Household |
| Czechoslovakians | 99.3 /100 | #95 | Exceptional 7.1% |
| Central Americans | 99.3 /100 | #96 | Exceptional 7.1% |
| Celtics | 99.1 /100 | #97 | Exceptional 7.1% |
| Irish | 99.0 /100 | #98 | Exceptional 7.1% |
| Seminole | 98.8 /100 | #99 | Exceptional 7.0% |
| Taiwanese | 98.7 /100 | #100 | Exceptional 7.0% |
| Pakistanis | 98.7 /100 | #101 | Exceptional 7.0% |
| Asians | 98.6 /100 | #102 | Exceptional 7.0% |
| Blackfeet | 98.6 /100 | #103 | Exceptional 7.0% |
| Hmong | 98.3 /100 | #104 | Exceptional 7.0% |
| German Russians | 98.3 /100 | #105 | Exceptional 7.0% |
| Guatemalans | 98.1 /100 | #106 | Exceptional 7.0% |
| Nicaraguans | 98.0 /100 | #107 | Exceptional 7.0% |
| French | 97.7 /100 | #108 | Exceptional 6.9% |
| Filipinos | 97.6 /100 | #109 | Exceptional 6.9% |
Asian 4 or more Vehicles in Household Correlation Summary
| Measurement | Asian Data | 4 or more Vehicles in Household Data |
| Minimum | 0.26% | 0.45% |
| Maximum | 85.1% | 17.5% |
| Range | 84.9% | 17.0% |
| Mean | 36.2% | 7.9% |
| Median | 35.9% | 7.2% |
| Interquartile 25% (IQ1) | 18.0% | 6.4% |
| Interquartile 75% (IQ3) | 54.0% | 9.5% |
| Interquartile Range (IQR) | 36.0% | 3.0% |
| Standard Deviation (Sample) | 21.3% | 3.1% |
| Standard Deviation (Population) | 21.2% | 3.1% |
Correlation Details
| Asian Percentile | Sample Size | 4 or more Vehicles in Household |
[ 0.0% - 0.5% ] 0.26% | 53,651,061 | 8.2% |
[ 0.5% - 1.0% ] 0.74% | 52,276,915 | 7.8% |
[ 1.0% - 1.5% ] 1.25% | 46,508,776 | 7.4% |
[ 1.5% - 2.0% ] 1.74% | 41,363,416 | 7.0% |
[ 2.0% - 2.5% ] 2.25% | 34,044,941 | 6.6% |
[ 2.5% - 3.0% ] 2.73% | 30,969,011 | 6.7% |
[ 3.0% - 3.5% ] 3.24% | 27,508,289 | 6.5% |
[ 3.5% - 4.0% ] 3.73% | 22,904,748 | 6.6% |
[ 4.0% - 4.5% ] 4.21% | 18,619,142 | 6.6% |
[ 4.5% - 5.0% ] 4.73% | 18,872,971 | 6.2% |
[ 5.0% - 5.5% ] 5.26% | 13,432,263 | 6.8% |
[ 5.5% - 6.0% ] 5.75% | 13,251,081 | 6.5% |
[ 6.0% - 6.5% ] 6.23% | 10,342,513 | 6.5% |
[ 6.5% - 7.0% ] 6.76% | 14,089,722 | 6.2% |
[ 7.0% - 7.5% ] 7.18% | 11,620,876 | 6.3% |
[ 7.5% - 8.0% ] 7.71% | 8,546,171 | 5.9% |
[ 8.0% - 8.5% ] 8.27% | 7,520,551 | 6.5% |
[ 8.5% - 9.0% ] 8.76% | 5,579,120 | 6.6% |
[ 9.0% - 9.5% ] 9.25% | 5,202,441 | 6.7% |
[ 9.5% - 10.0% ] 9.75% | 5,633,284 | 6.5% |
[ 10.0% - 10.5% ] 10.25% | 3,927,562 | 6.5% |
[ 10.5% - 11.0% ] 10.77% | 3,919,617 | 8.3% |
[ 11.0% - 11.5% ] 11.24% | 4,198,899 | 8.1% |
[ 11.5% - 12.0% ] 11.79% | 8,668,929 | 6.6% |
[ 12.0% - 12.5% ] 12.27% | 3,110,280 | 7.1% |
[ 12.5% - 13.0% ] 12.72% | 3,365,136 | 6.8% |
[ 13.0% - 13.5% ] 13.26% | 3,590,216 | 8.5% |
[ 13.5% - 14.0% ] 13.74% | 3,964,612 | 6.8% |
[ 14.0% - 14.5% ] 14.40% | 12,072,312 | 2.7% |
[ 14.5% - 15.0% ] 14.77% | 2,100,803 | 7.3% |
[ 15.0% - 15.5% ] 15.26% | 1,975,126 | 7.1% |
[ 15.5% - 16.0% ] 15.78% | 2,994,801 | 6.7% |
[ 16.0% - 16.5% ] 16.24% | 2,361,769 | 7.7% |
[ 16.5% - 17.0% ] 16.79% | 2,243,976 | 5.7% |
[ 17.0% - 17.5% ] 17.31% | 2,571,906 | 6.8% |
[ 17.5% - 18.0% ] 17.71% | 1,998,403 | 8.2% |
[ 18.0% - 18.5% ] 18.28% | 2,030,186 | 7.3% |
[ 18.5% - 19.0% ] 18.74% | 1,266,784 | 6.9% |
[ 19.0% - 19.5% ] 19.25% | 2,008,940 | 5.7% |
[ 19.5% - 20.0% ] 19.68% | 1,844,273 | 6.7% |
[ 20.0% - 20.5% ] 20.25% | 945,956 | 7.3% |
[ 20.5% - 21.0% ] 20.80% | 1,111,748 | 7.2% |
[ 21.0% - 21.5% ] 21.20% | 973,130 | 7.4% |
[ 21.5% - 22.0% ] 21.75% | 486,933 | 12.4% |
[ 22.0% - 22.5% ] 22.26% | 1,513,238 | 7.7% |
[ 22.5% - 23.0% ] 22.74% | 1,177,492 | 6.4% |
[ 23.0% - 23.5% ] 23.26% | 800,996 | 6.3% |
[ 23.5% - 24.0% ] 23.75% | 699,255 | 9.3% |
[ 24.0% - 24.5% ] 24.25% | 781,718 | 7.7% |
[ 24.5% - 25.0% ] 24.70% | 685,406 | 6.1% |
[ 25.0% - 25.5% ] 25.28% | 958,155 | 7.3% |
[ 25.5% - 26.0% ] 25.80% | 1,133,531 | 6.8% |
[ 26.0% - 26.5% ] 26.26% | 1,011,166 | 7.0% |
[ 26.5% - 27.0% ] 26.77% | 854,687 | 8.0% |
[ 27.0% - 27.5% ] 27.30% | 800,577 | 5.7% |
[ 27.5% - 28.0% ] 27.76% | 456,077 | 11.2% |
[ 28.0% - 28.5% ] 28.15% | 399,530 | 8.2% |
[ 28.5% - 29.0% ] 28.77% | 834,444 | 7.0% |
[ 29.0% - 29.5% ] 29.25% | 630,715 | 8.3% |
[ 29.5% - 30.0% ] 29.75% | 871,309 | 9.9% |
[ 30.0% - 30.5% ] 30.33% | 681,741 | 9.7% |
[ 30.5% - 31.0% ] 30.69% | 309,661 | 4.9% |
[ 31.0% - 31.5% ] 31.25% | 433,195 | 6.4% |
[ 31.5% - 32.0% ] 31.70% | 353,914 | 7.1% |
[ 32.0% - 32.5% ] 32.36% | 271,918 | 9.6% |
[ 32.5% - 33.0% ] 32.74% | 372,045 | 7.3% |
[ 33.0% - 33.5% ] 33.24% | 500,857 | 4.7% |
[ 33.5% - 34.0% ] 33.69% | 494,552 | 6.3% |
[ 34.0% - 34.5% ] 34.06% | 108,962 | 5.1% |
[ 34.5% - 35.0% ] 34.79% | 1,314,605 | 4.4% |
[ 35.0% - 35.5% ] 35.24% | 334,398 | 14.0% |
[ 35.5% - 36.0% ] 35.71% | 537,883 | 7.5% |
[ 36.0% - 36.5% ] 36.17% | 139,771 | 9.0% |
[ 36.5% - 37.0% ] 36.72% | 483,123 | 3.2% |
[ 37.0% - 37.5% ] 37.30% | 562,986 | 8.9% |
[ 37.5% - 38.0% ] 37.79% | 446,356 | 7.3% |
[ 38.0% - 38.5% ] 38.17% | 1,332,443 | 9.9% |
[ 38.5% - 39.0% ] 38.79% | 216,885 | 8.6% |
[ 39.0% - 39.5% ] 39.47% | 244,170 | 5.6% |
[ 39.5% - 40.0% ] 39.89% | 299,666 | 11.2% |
[ 40.0% - 40.5% ] 40.27% | 143,873 | 8.8% |
[ 40.5% - 41.0% ] 40.75% | 143,246 | 1.8% |
[ 41.0% - 41.5% ] 41.20% | 211,734 | 5.8% |
[ 41.5% - 42.0% ] 41.68% | 558,738 | 14.3% |
[ 42.0% - 42.5% ] 42.12% | 120,670 | 14.0% |
[ 42.5% - 43.0% ] 42.85% | 178,995 | 6.1% |
[ 43.0% - 43.5% ] 43.29% | 292,241 | 6.4% |
[ 43.5% - 44.0% ] 43.84% | 213,582 | 7.1% |
[ 44.0% - 44.5% ] 44.29% | 396,361 | 5.6% |
[ 44.5% - 45.0% ] 44.80% | 142,164 | 9.9% |
[ 45.0% - 45.5% ] 45.22% | 61,578 | 2.0% |
[ 45.5% - 46.0% ] 45.82% | 31,342 | 5.2% |
[ 46.0% - 46.5% ] 46.23% | 74,176 | 7.2% |
[ 46.5% - 47.0% ] 46.76% | 185,646 | 6.9% |
[ 47.0% - 47.5% ] 47.20% | 187,464 | 6.7% |
[ 47.5% - 48.0% ] 47.75% | 135,081 | 10.3% |
[ 48.0% - 48.5% ] 48.13% | 228,738 | 6.9% |
[ 48.5% - 49.0% ] 48.80% | 147,438 | 4.2% |
[ 49.0% - 49.5% ] 49.17% | 268,981 | 4.8% |
[ 49.5% - 50.0% ] 49.63% | 209,622 | 7.2% |
[ 50.0% - 50.5% ] 50.33% | 156,308 | 9.9% |
[ 50.5% - 51.0% ] 50.75% | 223,066 | 13.3% |
[ 51.0% - 51.5% ] 51.31% | 193,613 | 6.3% |
[ 51.5% - 52.0% ] 51.77% | 120,112 | 8.2% |
[ 52.0% - 52.5% ] 52.26% | 550,031 | 6.4% |
[ 52.5% - 53.0% ] 52.62% | 86,202 | 5.2% |
[ 53.0% - 53.5% ] 53.39% | 179,366 | 6.9% |
[ 53.5% - 54.0% ] 53.74% | 168,493 | 9.1% |
[ 54.0% - 54.5% ] 54.31% | 156,175 | 9.6% |
[ 54.5% - 55.0% ] 54.70% | 178,510 | 8.5% |
[ 55.0% - 55.5% ] 55.23% | 68,476 | 9.5% |
[ 55.5% - 56.0% ] 55.87% | 195,849 | 13.6% |
[ 56.0% - 56.5% ] 56.01% | 16,722 | 4.1% |
[ 56.5% - 57.0% ] 56.73% | 21,402 | 12.0% |
[ 57.0% - 57.5% ] 57.17% | 94,153 | 9.2% |
[ 57.5% - 58.0% ] 57.83% | 66,247 | 17.5% |
[ 58.0% - 58.5% ] 58.25% | 132,282 | 7.3% |
[ 58.5% - 59.0% ] 58.79% | 229,316 | 8.5% |
[ 59.0% - 59.5% ] 59.41% | 93,745 | 12.2% |
[ 59.5% - 60.0% ] 59.77% | 43,851 | 14.0% |
[ 60.0% - 60.5% ] 60.23% | 187,009 | 11.0% |
[ 60.5% - 61.0% ] 60.60% | 153,666 | 11.7% |
[ 61.0% - 61.5% ] 61.27% | 132,470 | 15.1% |
[ 61.5% - 62.0% ] 61.81% | 265,452 | 9.8% |
[ 62.0% - 62.5% ] 62.16% | 21,823 | 2.2% |
[ 62.5% - 63.0% ] 62.67% | 166,706 | 7.8% |
[ 63.0% - 63.5% ] 63.32% | 59,151 | 12.8% |
[ 63.5% - 64.0% ] 63.93% | 59,410 | 13.9% |
[ 64.5% - 65.0% ] 64.88% | 101,367 | 13.6% |
[ 65.0% - 65.5% ] 65.39% | 117,012 | 10.3% |
[ 65.5% - 66.0% ] 65.67% | 64,377 | 12.2% |
[ 66.0% - 66.5% ] 66.31% | 4,185 | 0.71% |
[ 66.5% - 67.0% ] 66.58% | 54,137 | 0.51% |
[ 67.0% - 67.5% ] 67.23% | 40,085 | 17.2% |
[ 68.0% - 68.5% ] 68.31% | 25,001 | 13.2% |
[ 68.5% - 69.0% ] 68.56% | 39,565 | 5.8% |
[ 69.0% - 69.5% ] 69.44% | 8,835 | 10.9% |
[ 69.5% - 70.0% ] 69.85% | 219,899 | 9.9% |
[ 70.0% - 70.5% ] 70.18% | 68,613 | 7.0% |
[ 70.5% - 71.0% ] 70.74% | 57,900 | 12.2% |
[ 72.5% - 73.0% ] 72.64% | 79,495 | 0.45% |
[ 74.0% - 74.5% ] 74.33% | 37,671 | 7.7% |
[ 77.0% - 77.5% ] 77.32% | 53,464 | 9.4% |
[ 85.0% - 85.5% ] 85.11% | 2,996 | 17.2% |