Greek 4 or more Vehicles in Household
COMPARE
Greek
Select to Compare
4 or more Vehicles in Household
Greek 4 or more Vehicles in Household
6.5%
4+ VEHICLES AVAILABLE
73.6/ 100
METRIC RATING
149th/ 347
METRIC RANK
Greek 4 or more Vehicles in Household Correlation Chart
The statistical analysis conducted on geographies consisting of 480,370,844 people shows a significant positive correlation between the proportion of Greeks and percentage of households with 4 or more vehicles available in the United States with a correlation coefficient (R) of 0.663 and weighted average of 6.5%. On average, for every 1% (one percent) increase in Greeks within a typical geography, there is an increase of 0.53% in percentage of households with 4 or more vehicles available.
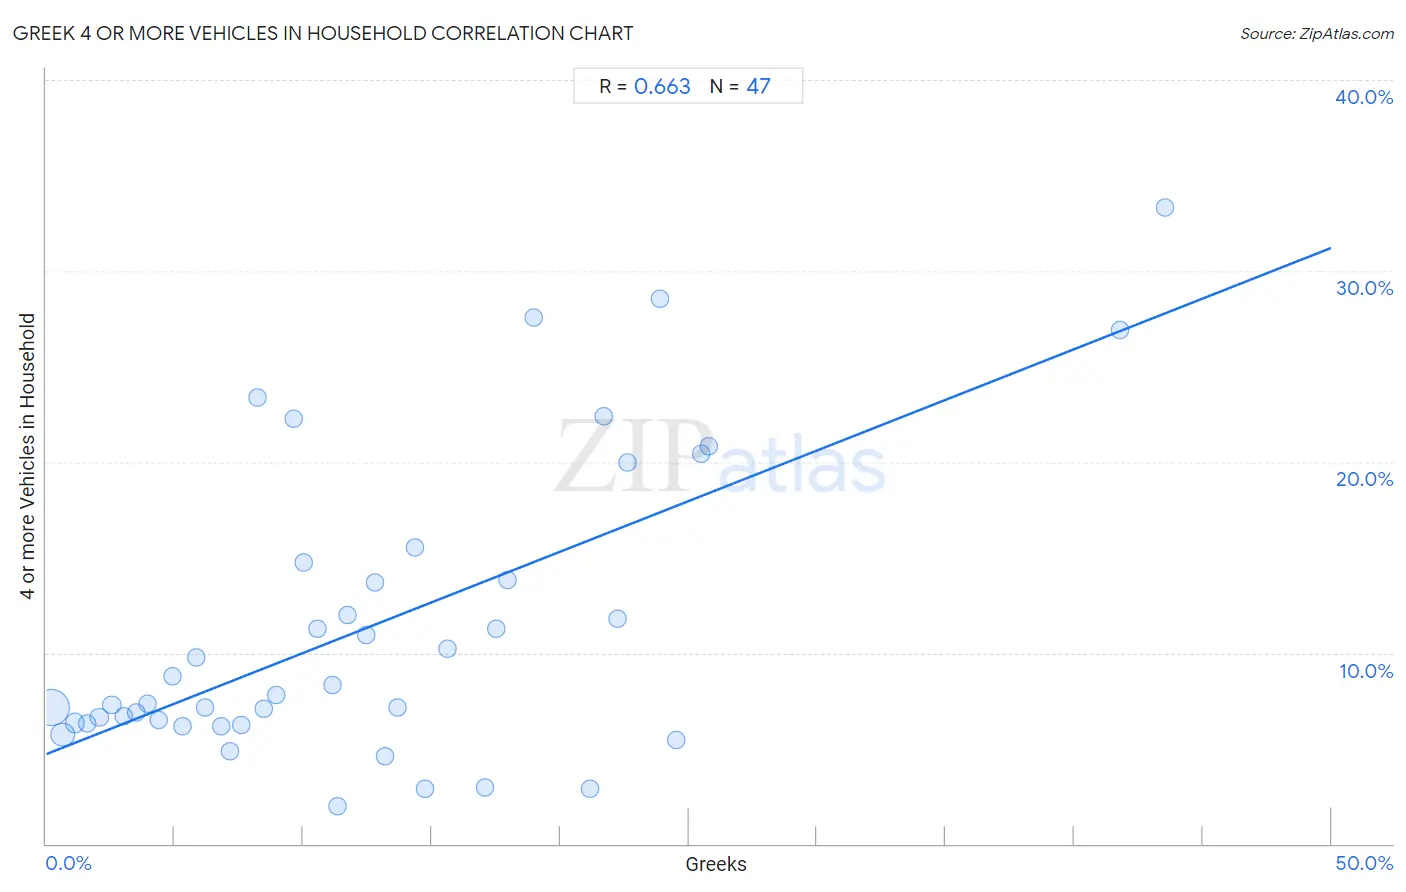
It is essential to understand that the correlation between the percentage of Greeks and percentage of households with 4 or more vehicles available does not imply a direct cause-and-effect relationship. It remains uncertain whether the presence of Greeks influences an upward or downward trend in the level of percentage of households with 4 or more vehicles available within an area, or if Greeks simply ended up residing in those areas with higher or lower levels of percentage of households with 4 or more vehicles available due to other factors.
Demographics Similar to Greeks by 4 or more Vehicles in Household
In terms of 4 or more vehicles in household, the demographic groups most similar to Greeks are Immigrants from Jordan (6.5%, a difference of 0.0%), Immigrants from Iran (6.5%, a difference of 0.040%), New Zealander (6.5%, a difference of 0.040%), Immigrants from Costa Rica (6.5%, a difference of 0.090%), and Immigrants from Hong Kong (6.5%, a difference of 0.18%).
| Demographics | Rating | Rank | 4 or more Vehicles in Household |
| Immigrants from Iraq | 79.4 /100 | #142 | Good 6.5% |
| Immigrants from Canada | 78.6 /100 | #143 | Good 6.5% |
| Immigrants from North America | 78.5 /100 | #144 | Good 6.5% |
| Croatians | 77.8 /100 | #145 | Good 6.5% |
| Immigrants from Costa Rica | 74.4 /100 | #146 | Good 6.5% |
| Immigrants from Iran | 73.9 /100 | #147 | Good 6.5% |
| Immigrants from Jordan | 73.7 /100 | #148 | Good 6.5% |
| Greeks | 73.6 /100 | #149 | Good 6.5% |
| New Zealanders | 73.3 /100 | #150 | Good 6.5% |
| Immigrants from Hong Kong | 72.2 /100 | #151 | Good 6.5% |
| Yuman | 72.1 /100 | #152 | Good 6.5% |
| Immigrants from Armenia | 71.2 /100 | #153 | Good 6.5% |
| Central American Indians | 71.1 /100 | #154 | Good 6.5% |
| Iroquois | 70.4 /100 | #155 | Good 6.5% |
| Iranians | 69.9 /100 | #156 | Good 6.5% |
Greek 4 or more Vehicles in Household Correlation Summary
| Measurement | Greek Data | 4 or more Vehicles in Household Data |
| Minimum | 0.21% | 2.0% |
| Maximum | 43.5% | 33.3% |
| Range | 43.3% | 31.4% |
| Mean | 12.7% | 11.4% |
| Median | 11.1% | 7.8% |
| Interquartile 25% (IQ1) | 5.3% | 6.3% |
| Interquartile 75% (IQ3) | 17.9% | 14.7% |
| Interquartile Range (IQR) | 12.7% | 8.4% |
| Standard Deviation (Sample) | 9.7% | 7.8% |
| Standard Deviation (Population) | 9.6% | 7.7% |
Correlation Details
| Greek Percentile | Sample Size | 4 or more Vehicles in Household |
[ 0.0% - 0.5% ] 0.21% | 328,905,934 | 7.2% |
[ 0.5% - 1.0% ] 0.65% | 102,573,109 | 5.7% |
[ 1.0% - 1.5% ] 1.11% | 26,822,438 | 6.3% |
[ 1.5% - 2.0% ] 1.61% | 10,892,874 | 6.3% |
[ 2.0% - 2.5% ] 2.06% | 4,355,007 | 6.6% |
[ 2.5% - 3.0% ] 2.55% | 2,849,219 | 7.3% |
[ 2.5% - 3.0% ] 3.00% | 1,527,849 | 6.7% |
[ 3.0% - 3.5% ] 3.50% | 780,527 | 6.9% |
[ 3.5% - 4.0% ] 3.95% | 342,675 | 7.3% |
[ 4.0% - 4.5% ] 4.40% | 501,033 | 6.5% |
[ 4.5% - 5.0% ] 4.91% | 149,021 | 8.7% |
[ 5.0% - 5.5% ] 5.29% | 162,500 | 6.2% |
[ 5.5% - 6.0% ] 5.82% | 131,189 | 9.8% |
[ 6.0% - 6.5% ] 6.20% | 101,494 | 7.2% |
[ 6.5% - 7.0% ] 6.80% | 59,905 | 6.2% |
[ 7.0% - 7.5% ] 7.17% | 82,861 | 4.8% |
[ 7.5% - 8.0% ] 7.60% | 31,071 | 6.2% |
[ 8.0% - 8.5% ] 8.22% | 1,277 | 23.4% |
[ 8.0% - 8.5% ] 8.48% | 1,746 | 7.1% |
[ 8.5% - 9.0% ] 8.93% | 1,534 | 7.8% |
[ 9.5% - 10.0% ] 9.64% | 7,968 | 22.3% |
[ 10.0% - 10.5% ] 10.01% | 7,410 | 14.7% |
[ 10.5% - 11.0% ] 10.54% | 370 | 11.3% |
[ 11.0% - 11.5% ] 11.13% | 11,557 | 8.3% |
[ 11.0% - 11.5% ] 11.31% | 50,119 | 2.0% |
[ 11.5% - 12.0% ] 11.72% | 2,612 | 12.0% |
[ 12.0% - 12.5% ] 12.45% | 1,638 | 10.9% |
[ 12.5% - 13.0% ] 12.78% | 970 | 13.7% |
[ 13.0% - 13.5% ] 13.17% | 463 | 4.6% |
[ 13.5% - 14.0% ] 13.68% | 665 | 7.1% |
[ 14.0% - 14.5% ] 14.35% | 223 | 15.5% |
[ 14.5% - 15.0% ] 14.72% | 3,588 | 2.9% |
[ 15.5% - 16.0% ] 15.62% | 4,226 | 10.2% |
[ 17.0% - 17.5% ] 17.07% | 943 | 3.0% |
[ 17.5% - 18.0% ] 17.53% | 753 | 11.3% |
[ 17.5% - 18.0% ] 17.95% | 234 | 13.8% |
[ 18.5% - 19.0% ] 18.95% | 438 | 27.6% |
[ 21.0% - 21.5% ] 21.13% | 1,940 | 2.9% |
[ 21.5% - 22.0% ] 21.68% | 143 | 22.4% |
[ 22.0% - 22.5% ] 22.22% | 72 | 11.8% |
[ 22.5% - 23.0% ] 22.63% | 137 | 20.0% |
[ 23.5% - 24.0% ] 23.86% | 88 | 28.6% |
[ 24.0% - 24.5% ] 24.49% | 49 | 5.4% |
[ 25.5% - 26.0% ] 25.51% | 396 | 20.4% |
[ 25.5% - 26.0% ] 25.77% | 392 | 20.8% |
[ 41.5% - 42.0% ] 41.77% | 79 | 26.9% |
[ 43.5% - 44.0% ] 43.52% | 108 | 33.3% |