Pueblo 4 or more Vehicles in Household
COMPARE
Pueblo
Select to Compare
4 or more Vehicles in Household
Pueblo 4 or more Vehicles in Household
8.6%
4+ VEHICLES AVAILABLE
100.0/ 100
METRIC RATING
20th/ 347
METRIC RANK
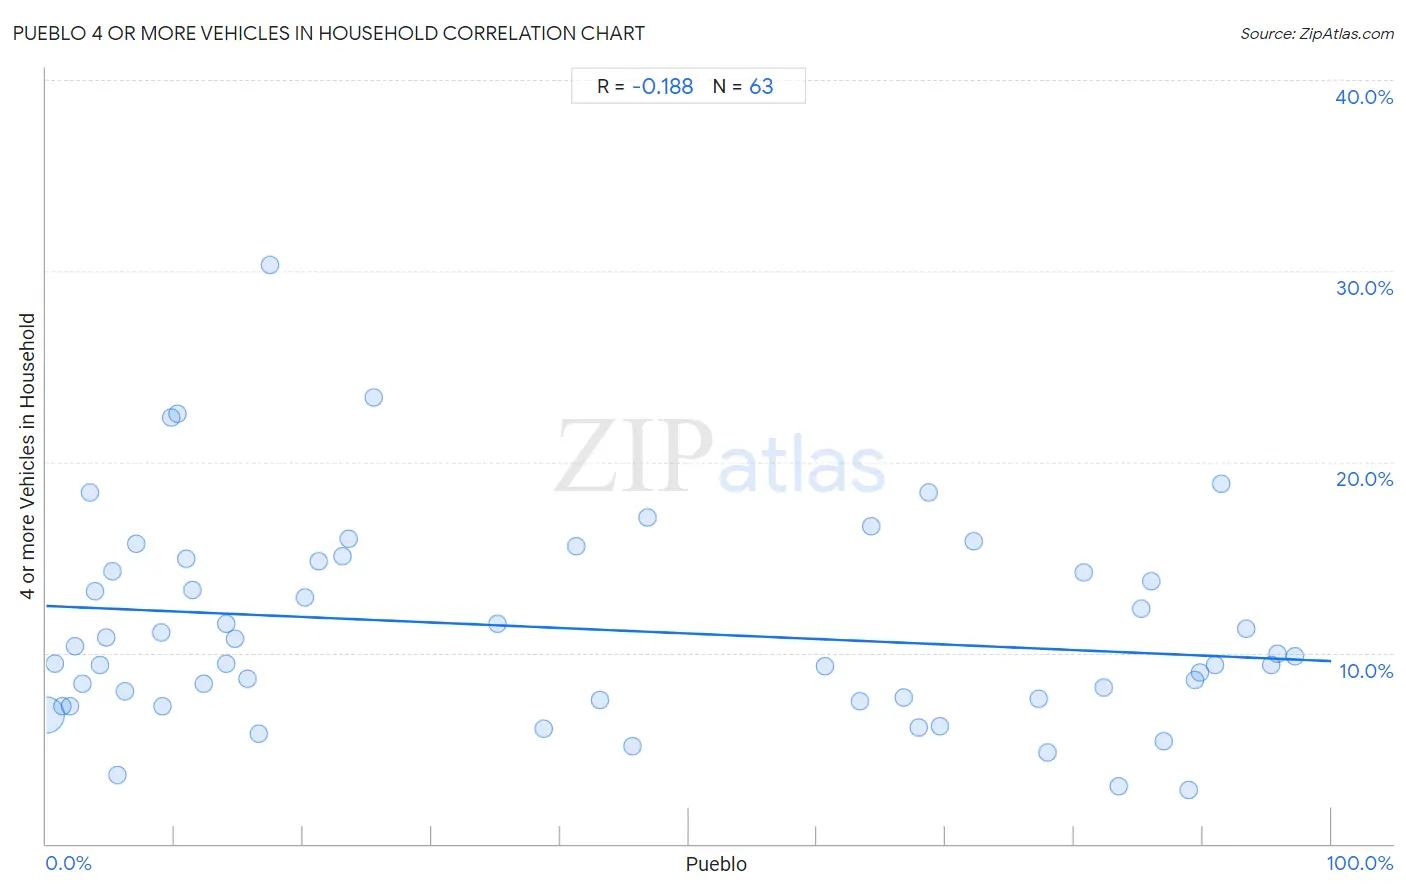
Pueblo 4 or more Vehicles in Household Correlation Chart
The statistical analysis conducted on geographies consisting of 119,746,372 people shows a poor negative correlation between the proportion of Pueblo and percentage of households with 4 or more vehicles available in the United States with a correlation coefficient (R) of -0.188 and weighted average of 8.6%. On average, for every 1% (one percent) increase in Pueblo within a typical geography, there is a decrease of 0.029% in percentage of households with 4 or more vehicles available.
It is essential to understand that the correlation between the percentage of Pueblo and percentage of households with 4 or more vehicles available does not imply a direct cause-and-effect relationship. It remains uncertain whether the presence of Pueblo influences an upward or downward trend in the level of percentage of households with 4 or more vehicles available within an area, or if Pueblo simply ended up residing in those areas with higher or lower levels of percentage of households with 4 or more vehicles available due to other factors.
Demographics Similar to Pueblo by 4 or more Vehicles in Household
In terms of 4 or more vehicles in household, the demographic groups most similar to Pueblo are Danish (8.6%, a difference of 0.050%), Immigrants from Vietnam (8.6%, a difference of 0.10%), Immigrants from Philippines (8.5%, a difference of 0.31%), Korean (8.6%, a difference of 0.82%), and Immigrants from Central America (8.5%, a difference of 1.1%).
| Demographics | Rating | Rank | 4 or more Vehicles in Household |
| Hawaiians | 100.0 /100 | #13 | Exceptional 8.9% |
| Chinese | 100.0 /100 | #14 | Exceptional 8.8% |
| Shoshone | 100.0 /100 | #15 | Exceptional 8.8% |
| Lumbee | 100.0 /100 | #16 | Exceptional 8.8% |
| Ute | 100.0 /100 | #17 | Exceptional 8.8% |
| Nepalese | 100.0 /100 | #18 | Exceptional 8.7% |
| Koreans | 100.0 /100 | #19 | Exceptional 8.6% |
| Pueblo | 100.0 /100 | #20 | Exceptional 8.6% |
| Danes | 100.0 /100 | #21 | Exceptional 8.6% |
| Immigrants from Vietnam | 100.0 /100 | #22 | Exceptional 8.6% |
| Immigrants from Philippines | 100.0 /100 | #23 | Exceptional 8.5% |
| Immigrants from Central America | 100.0 /100 | #24 | Exceptional 8.5% |
| Basques | 100.0 /100 | #25 | Exceptional 8.4% |
| Mexican American Indians | 100.0 /100 | #26 | Exceptional 8.4% |
| Sri Lankans | 100.0 /100 | #27 | Exceptional 8.4% |
Pueblo 4 or more Vehicles in Household Correlation Summary
| Measurement | Pueblo Data | 4 or more Vehicles in Household Data |
| Minimum | 0.045% | 2.8% |
| Maximum | 97.2% | 30.3% |
| Range | 97.2% | 27.5% |
| Mean | 41.3% | 11.3% |
| Median | 25.5% | 9.8% |
| Interquartile 25% (IQ1) | 9.0% | 7.5% |
| Interquartile 75% (IQ3) | 78.0% | 14.8% |
| Interquartile Range (IQR) | 69.0% | 7.3% |
| Standard Deviation (Sample) | 34.8% | 5.3% |
| Standard Deviation (Population) | 34.6% | 5.3% |
Correlation Details
| Pueblo Percentile | Sample Size | 4 or more Vehicles in Household |
[ 0.0% - 0.5% ] 0.045% | 116,359,560 | 6.8% |
[ 0.5% - 1.0% ] 0.68% | 1,453,093 | 9.5% |
[ 1.0% - 1.5% ] 1.28% | 1,223,253 | 7.2% |
[ 1.5% - 2.0% ] 1.81% | 265,949 | 7.2% |
[ 2.0% - 2.5% ] 2.21% | 31,337 | 10.3% |
[ 2.5% - 3.0% ] 2.85% | 102,313 | 8.4% |
[ 3.0% - 3.5% ] 3.38% | 6,854 | 18.4% |
[ 3.5% - 4.0% ] 3.77% | 11,232 | 13.2% |
[ 4.0% - 4.5% ] 4.18% | 120,302 | 9.4% |
[ 4.5% - 5.0% ] 4.64% | 11,534 | 10.8% |
[ 5.0% - 5.5% ] 5.20% | 7,505 | 14.3% |
[ 5.5% - 6.0% ] 5.53% | 1,646 | 3.6% |
[ 6.0% - 6.5% ] 6.10% | 2,902 | 8.0% |
[ 7.0% - 7.5% ] 7.00% | 20,354 | 15.7% |
[ 8.5% - 9.0% ] 8.91% | 18,479 | 11.1% |
[ 9.0% - 9.5% ] 9.00% | 422 | 7.2% |
[ 9.5% - 10.0% ] 9.69% | 1,063 | 22.3% |
[ 10.0% - 10.5% ] 10.17% | 423 | 22.5% |
[ 10.5% - 11.0% ] 10.91% | 1,549 | 14.9% |
[ 11.0% - 11.5% ] 11.40% | 1,790 | 13.3% |
[ 12.0% - 12.5% ] 12.25% | 547 | 8.4% |
[ 13.5% - 14.0% ] 13.97% | 11,614 | 9.4% |
[ 14.0% - 14.5% ] 14.02% | 1,583 | 11.6% |
[ 14.5% - 15.0% ] 14.72% | 15,895 | 10.7% |
[ 15.5% - 16.0% ] 15.69% | 1,472 | 8.6% |
[ 16.5% - 17.0% ] 16.52% | 932 | 5.8% |
[ 17.0% - 17.5% ] 17.42% | 310 | 30.3% |
[ 20.0% - 20.5% ] 20.14% | 422 | 12.9% |
[ 21.0% - 21.5% ] 21.20% | 2,165 | 14.8% |
[ 23.0% - 23.5% ] 23.03% | 2,336 | 15.1% |
[ 23.5% - 24.0% ] 23.58% | 971 | 16.0% |
[ 25.5% - 26.0% ] 25.50% | 5,450 | 23.4% |
[ 35.0% - 35.5% ] 35.16% | 219 | 11.5% |
[ 38.5% - 39.0% ] 38.72% | 3,817 | 6.0% |
[ 41.0% - 41.5% ] 41.23% | 2,906 | 15.6% |
[ 43.0% - 43.5% ] 43.06% | 922 | 7.5% |
[ 45.5% - 46.0% ] 45.60% | 728 | 5.1% |
[ 46.5% - 47.0% ] 46.83% | 378 | 17.1% |
[ 60.5% - 61.0% ] 60.63% | 1,270 | 9.3% |
[ 63.0% - 63.5% ] 63.32% | 2,841 | 7.5% |
[ 64.0% - 64.5% ] 64.25% | 3,393 | 16.6% |
[ 66.5% - 67.0% ] 66.75% | 2,021 | 7.7% |
[ 67.5% - 68.0% ] 67.86% | 1,422 | 6.1% |
[ 68.5% - 69.0% ] 68.70% | 722 | 18.4% |
[ 69.5% - 70.0% ] 69.51% | 515 | 6.1% |
[ 72.0% - 72.5% ] 72.20% | 957 | 15.9% |
[ 77.0% - 77.5% ] 77.26% | 5,520 | 7.6% |
[ 77.5% - 78.0% ] 77.96% | 481 | 4.8% |
[ 80.5% - 81.0% ] 80.72% | 1,006 | 14.2% |
[ 82.0% - 82.5% ] 82.27% | 1,173 | 8.2% |
[ 83.0% - 83.5% ] 83.49% | 527 | 3.0% |
[ 85.0% - 85.5% ] 85.19% | 574 | 12.3% |
[ 85.5% - 86.0% ] 85.97% | 1,283 | 13.7% |
[ 86.5% - 87.0% ] 86.99% | 1,430 | 5.4% |
[ 88.5% - 89.0% ] 88.93% | 1,824 | 2.8% |
[ 89.0% - 89.5% ] 89.37% | 2,070 | 8.6% |
[ 89.5% - 90.0% ] 89.82% | 1,877 | 9.0% |
[ 90.5% - 91.0% ] 90.94% | 1,743 | 9.3% |
[ 91.0% - 91.5% ] 91.45% | 620 | 18.8% |
[ 93.0% - 93.5% ] 93.42% | 730 | 11.3% |
[ 95.0% - 95.5% ] 95.35% | 2,324 | 9.3% |
[ 95.5% - 96.0% ] 95.79% | 9,033 | 10.0% |
[ 97.0% - 97.5% ] 97.20% | 6,789 | 9.8% |