Immigrants from Sri Lanka 4 or more Vehicles in Household
COMPARE
Immigrants from Sri Lanka
Select to Compare
4 or more Vehicles in Household
Immigrants from Sri Lanka 4 or more Vehicles in Household
6.1%
4+ VEHICLES AVAILABLE
23.7/ 100
METRIC RATING
197th/ 347
METRIC RANK
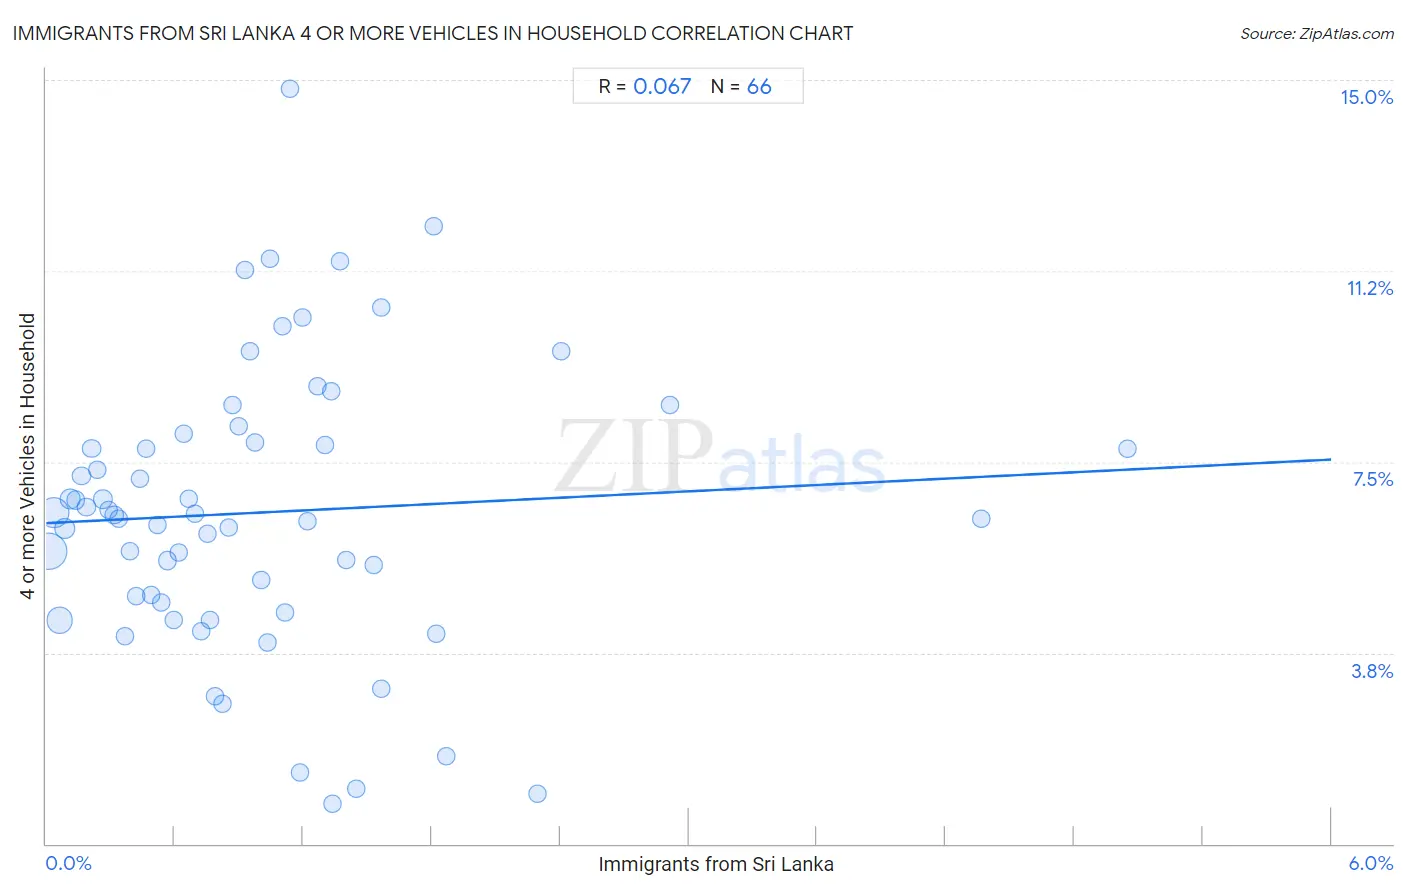
Immigrants from Sri Lanka 4 or more Vehicles in Household Correlation Chart
The statistical analysis conducted on geographies consisting of 149,309,194 people shows a slight positive correlation between the proportion of Immigrants from Sri Lanka and percentage of households with 4 or more vehicles available in the United States with a correlation coefficient (R) of 0.067 and weighted average of 6.1%. On average, for every 1% (one percent) increase in Immigrants from Sri Lanka within a typical geography, there is an increase of 0.21% in percentage of households with 4 or more vehicles available.
It is essential to understand that the correlation between the percentage of Immigrants from Sri Lanka and percentage of households with 4 or more vehicles available does not imply a direct cause-and-effect relationship. It remains uncertain whether the presence of Immigrants from Sri Lanka influences an upward or downward trend in the level of percentage of households with 4 or more vehicles available within an area, or if Immigrants from Sri Lanka simply ended up residing in those areas with higher or lower levels of percentage of households with 4 or more vehicles available due to other factors.
Demographics Similar to Immigrants from Sri Lanka by 4 or more Vehicles in Household
In terms of 4 or more vehicles in household, the demographic groups most similar to Immigrants from Sri Lanka are Immigrants from Portugal (6.1%, a difference of 0.20%), Immigrants from Norway (6.1%, a difference of 0.29%), Latvian (6.1%, a difference of 0.29%), Egyptian (6.1%, a difference of 0.35%), and Immigrants from South Central Asia (6.1%, a difference of 0.36%).
| Demographics | Rating | Rank | 4 or more Vehicles in Household |
| South Africans | 32.2 /100 | #190 | Fair 6.2% |
| Inupiat | 30.7 /100 | #191 | Fair 6.2% |
| Romanians | 30.7 /100 | #192 | Fair 6.2% |
| Immigrants from Kuwait | 28.0 /100 | #193 | Fair 6.2% |
| Immigrants from Sweden | 27.0 /100 | #194 | Fair 6.2% |
| Argentineans | 27.0 /100 | #195 | Fair 6.2% |
| Tsimshian | 26.4 /100 | #196 | Fair 6.2% |
| Immigrants from Sri Lanka | 23.7 /100 | #197 | Fair 6.1% |
| Immigrants from Portugal | 22.3 /100 | #198 | Fair 6.1% |
| Immigrants from Norway | 21.8 /100 | #199 | Fair 6.1% |
| Latvians | 21.7 /100 | #200 | Fair 6.1% |
| Egyptians | 21.4 /100 | #201 | Fair 6.1% |
| Immigrants from South Central Asia | 21.3 /100 | #202 | Fair 6.1% |
| Immigrants from Sierra Leone | 20.5 /100 | #203 | Fair 6.1% |
| Immigrants from Belize | 19.8 /100 | #204 | Poor 6.1% |
Immigrants from Sri Lanka 4 or more Vehicles in Household Correlation Summary
| Measurement | Immigrants from Sri Lanka Data | 4 or more Vehicles in Household Data |
| Minimum | 0.013% | 0.78% |
| Maximum | 5.0% | 14.8% |
| Range | 5.0% | 14.0% |
| Mean | 1.00% | 6.5% |
| Median | 0.84% | 6.4% |
| Interquartile 25% (IQ1) | 0.42% | 4.7% |
| Interquartile 75% (IQ3) | 1.3% | 7.9% |
| Interquartile Range (IQR) | 0.88% | 3.1% |
| Standard Deviation (Sample) | 0.90% | 2.8% |
| Standard Deviation (Population) | 0.89% | 2.8% |
Correlation Details
| Immigrants from Sri Lanka Percentile | Sample Size | 4 or more Vehicles in Household |
[ 0.0% - 0.5% ] 0.013% | 55,536,664 | 5.7% |
[ 0.0% - 0.5% ] 0.037% | 36,201,139 | 6.5% |
[ 0.0% - 0.5% ] 0.062% | 24,297,786 | 4.4% |
[ 0.0% - 0.5% ] 0.087% | 8,866,601 | 6.2% |
[ 0.0% - 0.5% ] 0.11% | 6,211,125 | 6.8% |
[ 0.0% - 0.5% ] 0.14% | 3,255,541 | 6.8% |
[ 0.0% - 0.5% ] 0.16% | 2,210,902 | 7.2% |
[ 0.0% - 0.5% ] 0.19% | 2,524,845 | 6.6% |
[ 0.0% - 0.5% ] 0.21% | 1,542,447 | 7.8% |
[ 0.0% - 0.5% ] 0.24% | 1,147,156 | 7.3% |
[ 0.0% - 0.5% ] 0.27% | 1,422,766 | 6.8% |
[ 0.0% - 0.5% ] 0.29% | 839,163 | 6.6% |
[ 0.0% - 0.5% ] 0.32% | 746,064 | 6.5% |
[ 0.0% - 0.5% ] 0.34% | 425,560 | 6.4% |
[ 0.0% - 0.5% ] 0.37% | 307,009 | 4.1% |
[ 0.0% - 0.5% ] 0.39% | 282,864 | 5.7% |
[ 0.0% - 0.5% ] 0.42% | 650,090 | 4.9% |
[ 0.0% - 0.5% ] 0.44% | 265,889 | 7.2% |
[ 0.0% - 0.5% ] 0.47% | 503,926 | 7.8% |
[ 0.0% - 0.5% ] 0.49% | 275,868 | 4.9% |
[ 0.5% - 1.0% ] 0.52% | 131,404 | 6.3% |
[ 0.5% - 1.0% ] 0.54% | 170,558 | 4.7% |
[ 0.5% - 1.0% ] 0.57% | 232,192 | 5.6% |
[ 0.5% - 1.0% ] 0.60% | 143,787 | 4.4% |
[ 0.5% - 1.0% ] 0.62% | 48,463 | 5.7% |
[ 0.5% - 1.0% ] 0.64% | 31,999 | 8.0% |
[ 0.5% - 1.0% ] 0.67% | 47,964 | 6.8% |
[ 0.5% - 1.0% ] 0.70% | 116,022 | 6.5% |
[ 0.5% - 1.0% ] 0.72% | 73,852 | 4.2% |
[ 0.5% - 1.0% ] 0.75% | 15,177 | 6.1% |
[ 0.5% - 1.0% ] 0.76% | 104,875 | 4.4% |
[ 0.5% - 1.0% ] 0.79% | 39,791 | 2.9% |
[ 0.5% - 1.0% ] 0.82% | 31,743 | 2.8% |
[ 0.5% - 1.0% ] 0.85% | 18,482 | 6.2% |
[ 0.5% - 1.0% ] 0.87% | 51,982 | 8.6% |
[ 0.5% - 1.0% ] 0.90% | 4,669 | 8.2% |
[ 0.5% - 1.0% ] 0.93% | 59,975 | 11.3% |
[ 0.5% - 1.0% ] 0.95% | 60,574 | 9.7% |
[ 0.5% - 1.0% ] 0.98% | 63,423 | 7.9% |
[ 1.0% - 1.5% ] 1.01% | 51,470 | 5.2% |
[ 1.0% - 1.5% ] 1.03% | 2,997 | 4.0% |
[ 1.0% - 1.5% ] 1.05% | 28,514 | 11.5% |
[ 1.0% - 1.5% ] 1.10% | 10,516 | 10.2% |
[ 1.0% - 1.5% ] 1.12% | 35,378 | 4.5% |
[ 1.0% - 1.5% ] 1.14% | 8,071 | 14.8% |
[ 1.0% - 1.5% ] 1.19% | 26,239 | 1.4% |
[ 1.0% - 1.5% ] 1.20% | 17,308 | 10.3% |
[ 1.0% - 1.5% ] 1.22% | 45,052 | 6.3% |
[ 1.0% - 1.5% ] 1.27% | 4,254 | 9.0% |
[ 1.0% - 1.5% ] 1.30% | 20,325 | 7.8% |
[ 1.0% - 1.5% ] 1.33% | 8,956 | 8.9% |
[ 1.0% - 1.5% ] 1.34% | 1,570 | 0.78% |
[ 1.0% - 1.5% ] 1.37% | 9,324 | 11.4% |
[ 1.0% - 1.5% ] 1.40% | 1,497 | 5.6% |
[ 1.0% - 1.5% ] 1.45% | 4,761 | 1.1% |
[ 1.5% - 2.0% ] 1.53% | 1,308 | 5.5% |
[ 1.5% - 2.0% ] 1.56% | 192 | 10.5% |
[ 1.5% - 2.0% ] 1.57% | 27,083 | 3.1% |
[ 1.5% - 2.0% ] 1.81% | 2,653 | 12.1% |
[ 1.5% - 2.0% ] 1.82% | 2,585 | 4.1% |
[ 1.5% - 2.0% ] 1.87% | 18,567 | 1.7% |
[ 2.0% - 2.5% ] 2.30% | 4,181 | 0.99% |
[ 2.0% - 2.5% ] 2.40% | 208 | 9.7% |
[ 2.5% - 3.0% ] 2.91% | 9,312 | 8.6% |
[ 4.0% - 4.5% ] 4.36% | 1,146 | 6.4% |
[ 5.0% - 5.5% ] 5.05% | 5,390 | 7.7% |