Immigrants from Southern Europe 4 or more Vehicles in Household

COMPARE

Immigrants from Southern Europe
Race
Ancestry
AfghanAfricanAlaska NativeAlaskan AthabascanAlbanianAleutAlsatianAmericanApacheArabArapahoArgentineanArmenianAssyrian/Chaldean/SyriacAustralianAustrianBahamianBangladeshiBarbadianBasqueBelgianBelizeanBermudanBhutaneseBlackfeetBolivianBrazilianBritishBritish West IndianBulgarianBurmeseCajunCambodianCanadianCape VerdeanCarpatho RusynCelticCentral AmericanCentral American IndianCherokeeCheyenneChickasawChileanChineseChippewaChoctawColombianColvilleComancheCosta RicanCreeCreekCroatianCrowCubanCypriotCzechCzechoslovakianDanishDelawareDominicanDutchDutch West IndianEastern EuropeanEcuadorianEgyptianEnglishEstonianEthiopianEuropeanFijianFilipinoFinnishFrenchFrench American IndianFrench CanadianGermanGerman RussianGhanaianGreekGuamanian/ChamorroGuatemalanGuyaneseHaitianHmongHonduranHopiHoumaHungarianIcelanderIndian (Asian)IndonesianInupiatIranianIraqiIrishIroquoisIsraeliItalianJamaicanJapaneseJordanianKenyanKiowaKoreanLaotianLatvianLebaneseLiberianLithuanianLumbeeLuxembourgerMacedonianMalaysianMalteseMarshalleseMenomineeMexicanMexican American IndianMongolianMoroccanNative HawaiianNavajoNepaleseNew ZealanderNicaraguanNigerianNorthern EuropeanNorwegianOkinawanOsageOttawaPaiutePakistaniPalestinianPanamanianParaguayanPennsylvania GermanPeruvianPimaPolishPortuguesePotawatomiPuebloPuerto RicanPuget Sound SalishRomanianRussianSalvadoranSamoanScandinavianScotch-IrishScottishSeminoleSenegaleseSerbianShoshoneSierra LeoneanSiouxSlavicSlovakSloveneSomaliSouth AfricanSouth AmericanSouth American IndianSoviet UnionSpaniardSpanishSpanish AmericanSpanish American IndianSri LankanSubsaharan AfricanSudaneseSwedishSwissSyrianTaiwaneseThaiTlingit-HaidaTohono O'OdhamTonganTrinidadian and TobagonianTsimshianTurkishU.S. Virgin IslanderUgandanUkrainianUruguayanUteVenezuelanVietnameseWelshWest IndianYakamaYaquiYugoslavianYumanYup'ikZimbabwean
Immigration
NonimmigrantsImmigrantsAfghanistanAfricaAlbaniaArgentinaArmeniaAsiaAustraliaAustriaBahamasBangladeshBarbadosBelarusBelgiumBelizeBoliviaBosnia and HerzegovinaBrazilBulgariaBurma/MyanmarCabo VerdeCambodiaCameroonCanadaCaribbeanCentral AmericaChileChinaColombiaCongoCosta RicaCroatiaCubaCzechoslovakiaDenmarkDominicaDominican RepublicEastern AfricaEastern AsiaEastern EuropeEcuadorEgyptEl SalvadorEnglandEritreaEthiopiaEuropeFijiFranceGermanyGhanaGreeceGrenadaGuatemalaGuyanaHaitiHondurasHong KongHungaryIndiaIndonesiaIranIraqIrelandIsraelItalyJamaicaJapanJordanKazakhstanKenyaKoreaKuwaitLaosLatin AmericaLatviaLebanonLiberiaLithuaniaMalaysiaMexicoMicronesiaMiddle AfricaMoldovaMoroccoNepalNetherlandsNicaraguaNigeriaNorth AmericaNorth MacedoniaNorthern AfricaNorthern EuropeNorwayOceaniaPakistanPanamaPeruPhilippinesPolandPortugalRomaniaRussiaSaudi ArabiaScotlandSenegalSerbiaSierra LeoneSingaporeSomaliaSouth AfricaSouth AmericaSouth Central AsiaSouth Eastern AsiaSouthern EuropeSpainSri LankaSt. Vincent and the GrenadinesSudanSwedenSwitzerlandSyriaTaiwanThailandTrinidad and TobagoTurkeyUgandaUkraineUruguayUzbekistanVenezuelaVietnamWest IndiesWestern AfricaWestern AsiaWestern EuropeYemenZaireZimbabweAzores
Select to Compare
Race
Ancestry
AfghanAfricanAlaska NativeAlaskan AthabascanAlbanianAleutAlsatianAmericanApacheArabArapahoArgentineanArmenianAssyrian/Chaldean/SyriacAustralianAustrianBahamianBangladeshiBarbadianBasqueBelgianBelizeanBermudanBhutaneseBlackfeetBolivianBrazilianBritishBritish West IndianBulgarianBurmeseCajunCambodianCanadianCape VerdeanCarpatho RusynCelticCentral AmericanCentral American IndianCherokeeCheyenneChickasawChileanChineseChippewaChoctawColombianColvilleComancheCosta RicanCreeCreekCroatianCrowCubanCypriotCzechCzechoslovakianDanishDelawareDominicanDutchDutch West IndianEastern EuropeanEcuadorianEgyptianEnglishEstonianEthiopianEuropeanFijianFilipinoFinnishFrenchFrench American IndianFrench CanadianGermanGerman RussianGhanaianGreekGuamanian/ChamorroGuatemalanGuyaneseHaitianHmongHonduranHopiHoumaHungarianIcelanderIndian (Asian)IndonesianInupiatIranianIraqiIrishIroquoisIsraeliItalianJamaicanJapaneseJordanianKenyanKiowaKoreanLaotianLatvianLebaneseLiberianLithuanianLumbeeLuxembourgerMacedonianMalaysianMalteseMarshalleseMenomineeMexicanMexican American IndianMongolianMoroccanNative HawaiianNavajoNepaleseNew ZealanderNicaraguanNigerianNorthern EuropeanNorwegianOkinawanOsageOttawaPaiutePakistaniPalestinianPanamanianParaguayanPennsylvania GermanPeruvianPimaPolishPortuguesePotawatomiPuebloPuerto RicanPuget Sound SalishRomanianRussianSalvadoranSamoanScandinavianScotch-IrishScottishSeminoleSenegaleseSerbianShoshoneSierra LeoneanSiouxSlavicSlovakSloveneSomaliSouth AfricanSouth AmericanSouth American IndianSoviet UnionSpaniardSpanishSpanish AmericanSpanish American IndianSri LankanSubsaharan AfricanSudaneseSwedishSwissSyrianTaiwaneseThaiTlingit-HaidaTohono O'OdhamTonganTrinidadian and TobagonianTsimshianTurkishU.S. Virgin IslanderUgandanUkrainianUruguayanUteVenezuelanVietnameseWelshWest IndianYakamaYaquiYugoslavianYumanYup'ikZimbabwean
Immigration
NonimmigrantsImmigrantsAfghanistanAfricaAlbaniaArgentinaArmeniaAsiaAustraliaAustriaBahamasBangladeshBarbadosBelarusBelgiumBelizeBoliviaBosnia and HerzegovinaBrazilBulgariaBurma/MyanmarCabo VerdeCambodiaCameroonCanadaCaribbeanCentral AmericaChileChinaColombiaCongoCosta RicaCroatiaCubaCzechoslovakiaDenmarkDominicaDominican RepublicEastern AfricaEastern AsiaEastern EuropeEcuadorEgyptEl SalvadorEnglandEritreaEthiopiaEuropeFijiFranceGermanyGhanaGreeceGrenadaGuatemalaGuyanaHaitiHondurasHong KongHungaryIndiaIndonesiaIranIraqIrelandIsraelItalyJamaicaJapanJordanKazakhstanKenyaKoreaKuwaitLaosLatin AmericaLatviaLebanonLiberiaLithuaniaMalaysiaMexicoMicronesiaMiddle AfricaMoldovaMoroccoNepalNetherlandsNicaraguaNigeriaNorth AmericaNorth MacedoniaNorthern AfricaNorthern EuropeNorwayOceaniaPakistanPanamaPeruPhilippinesPolandPortugalRomaniaRussiaSaudi ArabiaScotlandSenegalSerbiaSierra LeoneSingaporeSomaliaSouth AfricaSouth AmericaSouth Central AsiaSouth Eastern AsiaSpainSri LankaSt. Vincent and the GrenadinesSudanSwedenSwitzerlandSyriaTaiwanThailandTrinidad and TobagoTurkeyUgandaUkraineUruguayUzbekistanVenezuelaVietnamWest IndiesWestern AfricaWestern AsiaWestern EuropeYemenZaireZimbabweAzores
4 or more Vehicles in Household
Income
Poverty
Unemployment
Labor Participation
Family Structure
Vehicle Availability
Education Level
Disability

Immigrants from Southern Europe 4 or more Vehicles in Household
Tragic

5.7%
4+ VEHICLES AVAILABLE
2.3/ 100
METRIC RATING
249th/ 347
METRIC RANK

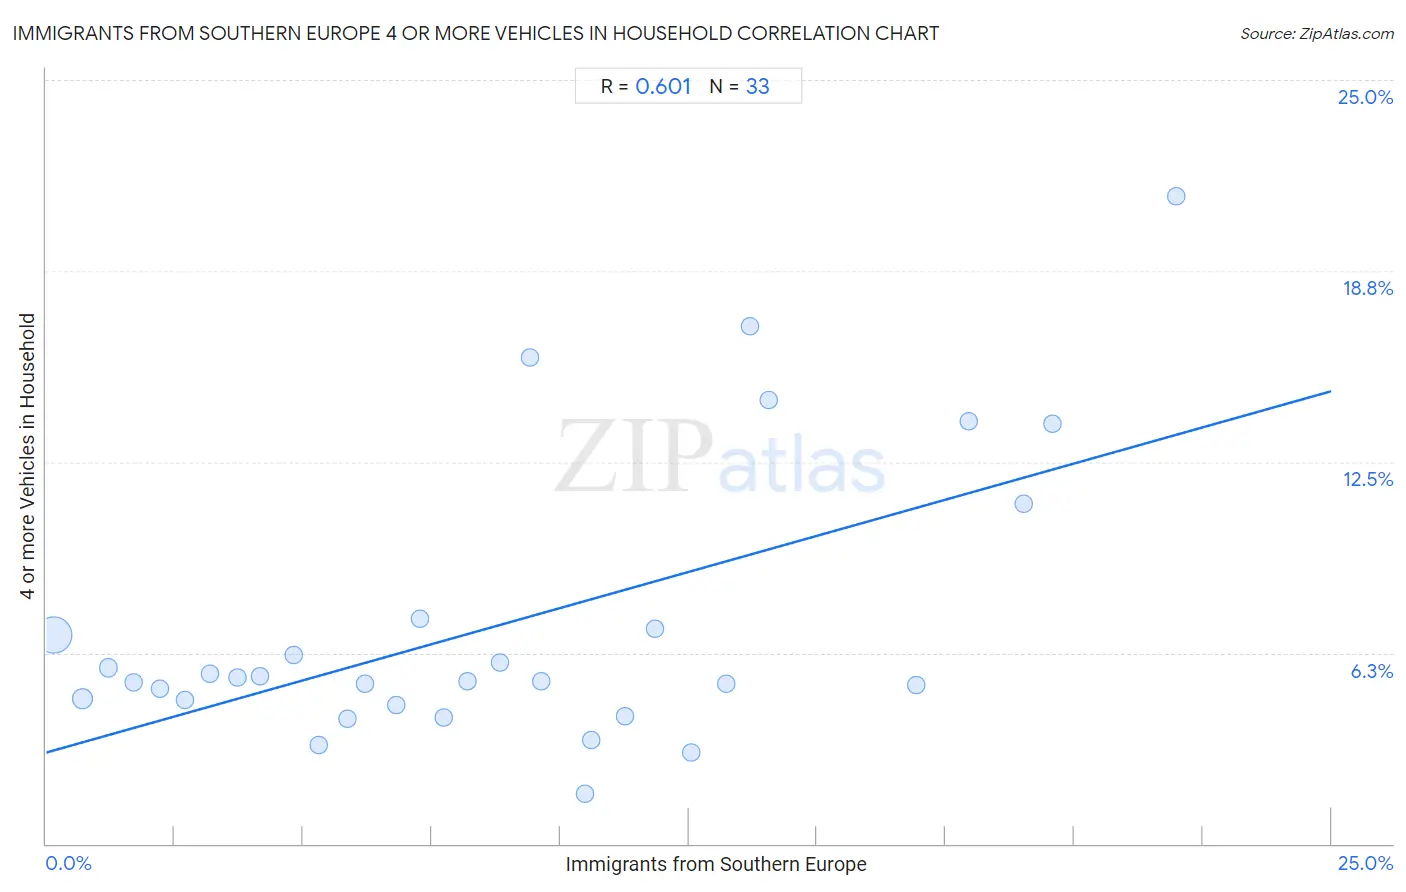
Immigrants from Southern Europe 4 or more Vehicles in Household Correlation Chart

The statistical analysis conducted on geographies consisting of 400,794,639 people shows a significant positive correlation between the proportion of Immigrants from Southern Europe and percentage of households with 4 or more vehicles available in the United States with a correlation coefficient (R) of 0.601 and weighted average of 5.7%. On average, for every 1% (one percent) increase in Immigrants from Southern Europe within a typical geography, there is an increase of 0.47% in percentage of households with 4 or more vehicles available.
Immigrants from Southern Europe 4 or more Vehicles in Household
It is essential to understand that the correlation between the percentage of Immigrants from Southern Europe and percentage of households with 4 or more vehicles available does not imply a direct cause-and-effect relationship. It remains uncertain whether the presence of Immigrants from Southern Europe influences an upward or downward trend in the level of percentage of households with 4 or more vehicles available within an area, or if Immigrants from Southern Europe simply ended up residing in those areas with higher or lower levels of percentage of households with 4 or more vehicles available due to other factors.

Demographics Similar to Immigrants from Southern Europe by 4 or more Vehicles in Household

In terms of 4 or more vehicles in household, the demographic groups most similar to Immigrants from Southern Europe are Immigrants from Eastern Africa (5.7%, a difference of 0.020%), Immigrants from Europe (5.7%, a difference of 0.10%), Ugandan (5.7%, a difference of 0.12%), Immigrants from Ethiopia (5.7%, a difference of 0.13%), and Immigrants from North Macedonia (5.7%, a difference of 0.16%).
DemographicsRating | Rank4 or more Vehicles in Household
Immigrants from Middle Africa
3.4
/100
|
#242
Tragic
5.8%
Immigrants from Czechoslovakia
3.2
/100
|
#243
Tragic
5.8%
Ethiopians
3.2
/100
|
#244
Tragic
5.8%
Bulgarians
3.1
/100
|
#245
Tragic
5.8%
Immigrants from North Macedonia
2.5
/100
|
#246
Tragic
5.7%
Immigrants from Ethiopia
2.4
/100
|
#247
Tragic
5.7%
Immigrants from Eastern Africa
2.4
/100
|
#248
Tragic
5.7%
Immigrants from Southern Europe
2.3
/100
|
#249
Tragic
5.7%
Immigrants from Europe
2.3
/100
|
#250
Tragic
5.7%
Ugandans
2.2
/100
|
#251
Tragic
5.7%
Sub-Saharan Africans
2.1
/100
|
#252
Tragic
5.7%
Immigrants from Cuba
1.6
/100
|
#253
Tragic
5.7%
Immigrants from Panama
1.5
/100
|
#254
Tragic
5.7%
Yup'ik
1.5
/100
|
#255
Tragic
5.7%
Immigrants from Turkey
1.5
/100
|
#256
Tragic
5.7%

Immigrants from Southern Europe 4 or more Vehicles in Household Correlation Summary

MeasurementImmigrants from Southern Europe Data4 or more Vehicles in Household Data
Minimum0.15%1.6%
Maximum22.0%21.2%
Range21.8%19.6%
Mean8.9%7.2%
Median8.2%5.3%
Interquartile 25% (IQ1)3.9%4.6%
Interquartile 75% (IQ3)12.9%7.2%
Interquartile Range (IQR)9.0%2.6%
Standard Deviation (Sample)5.9%4.6%
Standard Deviation (Population)5.8%4.6%

Correlation Details

Immigrants from Southern Europe PercentileSample Size4 or more Vehicles in Household
[
0.0%
-
0.5%
]
0.15%
332,168,0166.8%
[
0.5%
-
1.0%
]
0.71%
45,545,8584.7%
[
1.0%
-
1.5%
]
1.21%
11,870,5895.8%
[
1.5%
-
2.0%
]
1.70%
4,549,1925.3%
[
2.0%
-
2.5%
]
2.22%
1,845,6235.1%
[
2.5%
-
3.0%
]
2.71%
1,645,7994.7%
[
3.0%
-
3.5%
]
3.20%
893,4635.6%
[
3.5%
-
4.0%
]
3.72%
577,4305.5%
[
4.0%
-
4.5%
]
4.15%
238,2315.5%
[
4.5%
-
5.0%
]
4.81%
266,6476.2%
[
5.0%
-
5.5%
]
5.30%
204,5033.2%
[
5.5%
-
6.0%
]
5.86%
93,4144.1%
[
6.0%
-
6.5%
]
6.19%
93,4695.3%
[
6.5%
-
7.0%
]
6.80%
98,3814.6%
[
7.0%
-
7.5%
]
7.27%
14,8377.3%
[
7.5%
-
8.0%
]
7.73%
217,5484.1%
[
8.0%
-
8.5%
]
8.19%
85,5035.3%
[
8.5%
-
9.0%
]
8.83%
55,8746.0%
[
9.0%
-
9.5%
]
9.41%
82915.9%
[
9.5%
-
10.0%
]
9.62%
45,4115.3%
[
10.0%
-
10.5%
]
10.49%
58,4011.6%
[
10.5%
-
11.0%
]
10.61%
12,4653.4%
[
11.0%
-
11.5%
]
11.27%
125,1234.2%
[
11.5%
-
12.0%
]
11.85%
25,9277.0%
[
12.5%
-
13.0%
]
12.55%
26,8073.0%
[
13.0%
-
13.5%
]
13.22%
21,7425.2%
[
13.5%
-
14.0%
]
13.69%
6,77316.9%
[
14.0%
-
14.5%
]
14.05%
12114.5%
[
16.5%
-
17.0%
]
16.93%
4,8205.2%
[
17.5%
-
18.0%
]
17.95%
23413.8%
[
19.0%
-
19.5%
]
19.01%
14211.1%
[
19.5%
-
20.0%
]
19.58%
1,14413.7%
[
21.5%
-
22.0%
]
21.98%
32321.2%