Macedonian 4 or more Vehicles in Household
COMPARE
Macedonian
Select to Compare
4 or more Vehicles in Household
Macedonian 4 or more Vehicles in Household
5.5%
4+ VEHICLES AVAILABLE
0.6/ 100
METRIC RATING
273rd/ 347
METRIC RANK
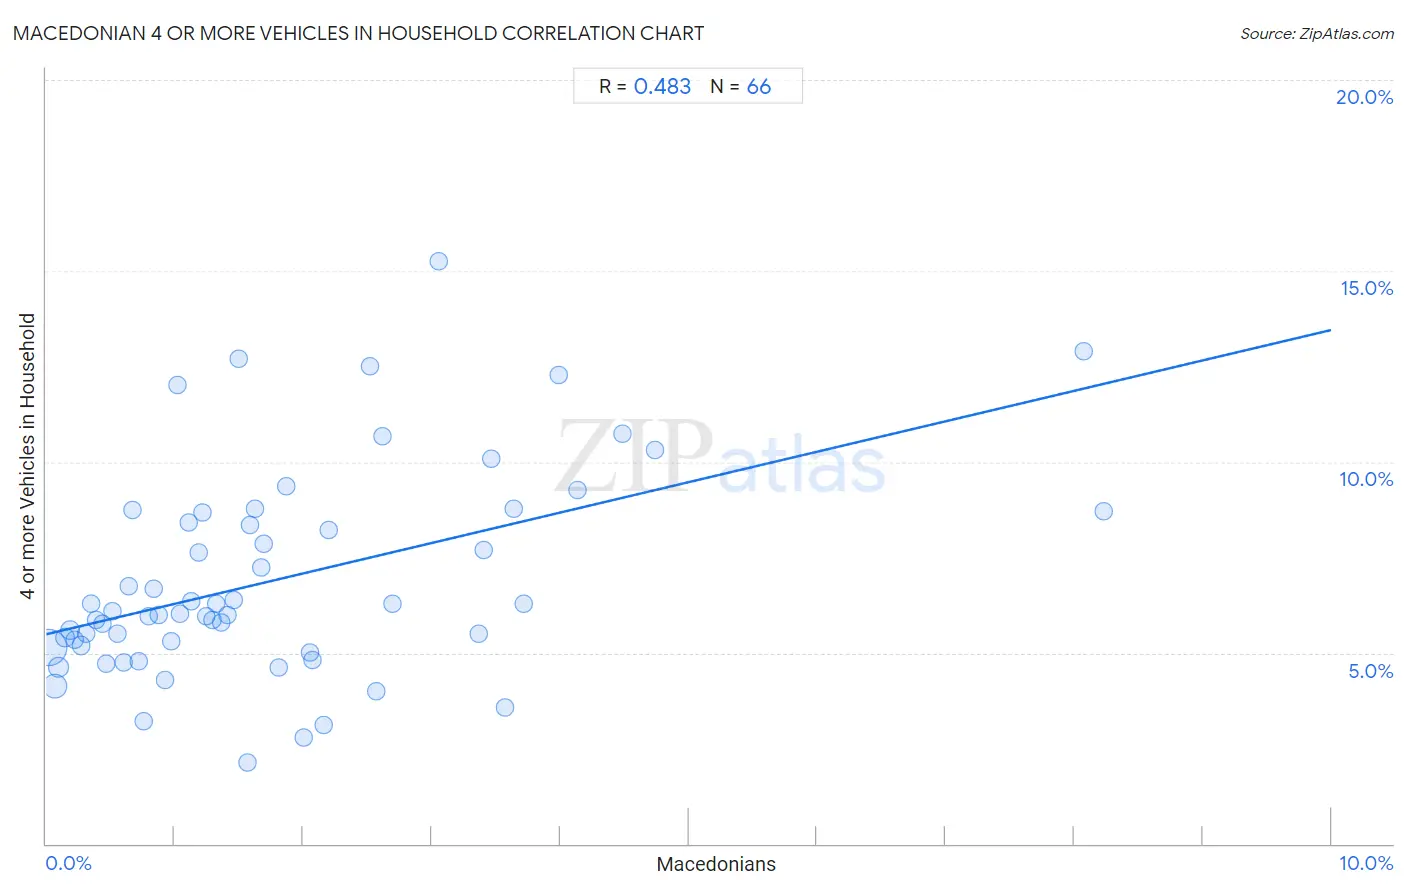
Macedonian 4 or more Vehicles in Household Correlation Chart
The statistical analysis conducted on geographies consisting of 131,939,711 people shows a moderate positive correlation between the proportion of Macedonians and percentage of households with 4 or more vehicles available in the United States with a correlation coefficient (R) of 0.483 and weighted average of 5.5%. On average, for every 1% (one percent) increase in Macedonians within a typical geography, there is an increase of 0.80% in percentage of households with 4 or more vehicles available.
It is essential to understand that the correlation between the percentage of Macedonians and percentage of households with 4 or more vehicles available does not imply a direct cause-and-effect relationship. It remains uncertain whether the presence of Macedonians influences an upward or downward trend in the level of percentage of households with 4 or more vehicles available within an area, or if Macedonians simply ended up residing in those areas with higher or lower levels of percentage of households with 4 or more vehicles available due to other factors.
Demographics Similar to Macedonians by 4 or more Vehicles in Household
In terms of 4 or more vehicles in household, the demographic groups most similar to Macedonians are Immigrants from Kazakhstan (5.5%, a difference of 0.030%), Black/African American (5.5%, a difference of 0.12%), Immigrants from Sudan (5.5%, a difference of 0.23%), Cambodian (5.5%, a difference of 0.24%), and Immigrants from Latvia (5.5%, a difference of 0.25%).
| Demographics | Rating | Rank | 4 or more Vehicles in Household |
| Immigrants from Nepal | 0.9 /100 | #266 | Tragic 5.6% |
| Immigrants from Ukraine | 0.9 /100 | #267 | Tragic 5.6% |
| Colombians | 0.7 /100 | #268 | Tragic 5.5% |
| Carpatho Rusyns | 0.7 /100 | #269 | Tragic 5.5% |
| Okinawans | 0.6 /100 | #270 | Tragic 5.5% |
| Immigrants from Sudan | 0.6 /100 | #271 | Tragic 5.5% |
| Immigrants from Kazakhstan | 0.6 /100 | #272 | Tragic 5.5% |
| Macedonians | 0.6 /100 | #273 | Tragic 5.5% |
| Blacks/African Americans | 0.6 /100 | #274 | Tragic 5.5% |
| Cambodians | 0.5 /100 | #275 | Tragic 5.5% |
| Immigrants from Latvia | 0.5 /100 | #276 | Tragic 5.5% |
| Immigrants from Bulgaria | 0.5 /100 | #277 | Tragic 5.5% |
| Immigrants from Eastern Europe | 0.4 /100 | #278 | Tragic 5.4% |
| Immigrants from Uruguay | 0.3 /100 | #279 | Tragic 5.4% |
| Alsatians | 0.3 /100 | #280 | Tragic 5.4% |
Macedonian 4 or more Vehicles in Household Correlation Summary
| Measurement | Macedonian Data | 4 or more Vehicles in Household Data |
| Minimum | 0.016% | 2.1% |
| Maximum | 8.2% | 15.3% |
| Range | 8.2% | 13.1% |
| Mean | 1.8% | 6.9% |
| Median | 1.3% | 6.1% |
| Interquartile 25% (IQ1) | 0.67% | 5.2% |
| Interquartile 75% (IQ3) | 2.5% | 8.7% |
| Interquartile Range (IQR) | 1.9% | 3.5% |
| Standard Deviation (Sample) | 1.6% | 2.7% |
| Standard Deviation (Population) | 1.6% | 2.7% |
Correlation Details
| Macedonian Percentile | Sample Size | 4 or more Vehicles in Household |
[ 0.0% - 0.5% ] 0.016% | 75,227,483 | 5.1% |
[ 0.0% - 0.5% ] 0.065% | 25,975,009 | 4.1% |
[ 0.0% - 0.5% ] 0.098% | 11,653,671 | 4.6% |
[ 0.0% - 0.5% ] 0.14% | 4,484,915 | 5.4% |
[ 0.0% - 0.5% ] 0.19% | 4,048,635 | 5.6% |
[ 0.0% - 0.5% ] 0.22% | 2,061,027 | 5.3% |
[ 0.0% - 0.5% ] 0.27% | 1,372,300 | 5.2% |
[ 0.0% - 0.5% ] 0.31% | 719,009 | 5.5% |
[ 0.0% - 0.5% ] 0.35% | 987,140 | 6.3% |
[ 0.0% - 0.5% ] 0.39% | 958,583 | 5.9% |
[ 0.0% - 0.5% ] 0.43% | 347,508 | 5.8% |
[ 0.0% - 0.5% ] 0.47% | 389,295 | 4.7% |
[ 0.5% - 1.0% ] 0.51% | 436,436 | 6.1% |
[ 0.5% - 1.0% ] 0.56% | 315,771 | 5.5% |
[ 0.5% - 1.0% ] 0.60% | 324,671 | 4.7% |
[ 0.5% - 1.0% ] 0.64% | 181,308 | 6.8% |
[ 0.5% - 1.0% ] 0.67% | 220,520 | 8.7% |
[ 0.5% - 1.0% ] 0.72% | 234,244 | 4.8% |
[ 0.5% - 1.0% ] 0.76% | 254,112 | 3.2% |
[ 0.5% - 1.0% ] 0.79% | 168,940 | 6.0% |
[ 0.5% - 1.0% ] 0.84% | 255,629 | 6.7% |
[ 0.5% - 1.0% ] 0.88% | 107,275 | 6.0% |
[ 0.5% - 1.0% ] 0.93% | 60,671 | 4.3% |
[ 0.5% - 1.0% ] 0.97% | 42,014 | 5.3% |
[ 1.0% - 1.5% ] 1.02% | 25,017 | 12.0% |
[ 1.0% - 1.5% ] 1.04% | 143,414 | 6.0% |
[ 1.0% - 1.5% ] 1.11% | 34,403 | 8.4% |
[ 1.0% - 1.5% ] 1.12% | 47,066 | 6.3% |
[ 1.0% - 1.5% ] 1.19% | 9,945 | 7.6% |
[ 1.0% - 1.5% ] 1.22% | 123,838 | 8.7% |
[ 1.0% - 1.5% ] 1.24% | 81,951 | 6.0% |
[ 1.0% - 1.5% ] 1.29% | 41,610 | 5.9% |
[ 1.0% - 1.5% ] 1.32% | 4,151 | 6.3% |
[ 1.0% - 1.5% ] 1.37% | 62,047 | 5.8% |
[ 1.0% - 1.5% ] 1.42% | 13,778 | 6.0% |
[ 1.0% - 1.5% ] 1.46% | 54,704 | 6.4% |
[ 1.0% - 1.5% ] 1.50% | 14,072 | 12.7% |
[ 1.5% - 2.0% ] 1.56% | 11,197 | 2.1% |
[ 1.5% - 2.0% ] 1.59% | 119,340 | 8.3% |
[ 1.5% - 2.0% ] 1.63% | 24,333 | 8.8% |
[ 1.5% - 2.0% ] 1.67% | 1,017 | 7.2% |
[ 1.5% - 2.0% ] 1.69% | 7,219 | 7.9% |
[ 1.5% - 2.0% ] 1.81% | 39,823 | 4.6% |
[ 1.5% - 2.0% ] 1.87% | 7,763 | 9.3% |
[ 2.0% - 2.5% ] 2.00% | 950 | 2.8% |
[ 2.0% - 2.5% ] 2.05% | 536 | 5.0% |
[ 2.0% - 2.5% ] 2.07% | 19,956 | 4.8% |
[ 2.0% - 2.5% ] 2.16% | 2,958 | 3.1% |
[ 2.0% - 2.5% ] 2.20% | 4,137 | 8.2% |
[ 2.5% - 3.0% ] 2.52% | 32,193 | 12.5% |
[ 2.5% - 3.0% ] 2.57% | 5,185 | 4.0% |
[ 2.5% - 3.0% ] 2.62% | 458 | 10.7% |
[ 2.5% - 3.0% ] 2.69% | 42,522 | 6.3% |
[ 3.0% - 3.5% ] 3.06% | 7,329 | 15.3% |
[ 3.0% - 3.5% ] 3.36% | 4,848 | 5.5% |
[ 3.0% - 3.5% ] 3.41% | 323 | 7.7% |
[ 3.0% - 3.5% ] 3.47% | 2,999 | 10.1% |
[ 3.5% - 4.0% ] 3.57% | 64,944 | 3.6% |
[ 3.5% - 4.0% ] 3.64% | 21,806 | 8.8% |
[ 3.5% - 4.0% ] 3.72% | 6,322 | 6.3% |
[ 3.5% - 4.0% ] 3.99% | 4,993 | 12.3% |
[ 4.0% - 4.5% ] 4.14% | 266 | 9.3% |
[ 4.0% - 4.5% ] 4.49% | 2,363 | 10.7% |
[ 4.5% - 5.0% ] 4.74% | 20,310 | 10.3% |
[ 8.0% - 8.5% ] 8.07% | 1,301 | 12.9% |
[ 8.0% - 8.5% ] 8.23% | 158 | 8.7% |