Houma 4 or more Vehicles in Household

COMPARE

Houma
Race
Ancestry
AfghanAfricanAlaska NativeAlaskan AthabascanAlbanianAleutAlsatianAmericanApacheArabArapahoArgentineanArmenianAssyrian/Chaldean/SyriacAustralianAustrianBahamianBangladeshiBarbadianBasqueBelgianBelizeanBermudanBhutaneseBlackfeetBolivianBrazilianBritishBritish West IndianBulgarianBurmeseCajunCambodianCanadianCape VerdeanCarpatho RusynCelticCentral AmericanCentral American IndianCherokeeCheyenneChickasawChileanChineseChippewaChoctawColombianColvilleComancheCosta RicanCreeCreekCroatianCrowCubanCypriotCzechCzechoslovakianDanishDelawareDominicanDutchDutch West IndianEastern EuropeanEcuadorianEgyptianEnglishEstonianEthiopianEuropeanFijianFilipinoFinnishFrenchFrench American IndianFrench CanadianGermanGerman RussianGhanaianGreekGuamanian/ChamorroGuatemalanGuyaneseHaitianHmongHonduranHopiHoumaHungarianIcelanderIndian (Asian)IndonesianInupiatIranianIraqiIrishIroquoisIsraeliItalianJamaicanJapaneseJordanianKenyanKiowaKoreanLaotianLatvianLebaneseLiberianLithuanianLumbeeLuxembourgerMacedonianMalaysianMalteseMarshalleseMenomineeMexicanMexican American IndianMongolianMoroccanNative HawaiianNavajoNepaleseNew ZealanderNicaraguanNigerianNorthern EuropeanNorwegianOkinawanOsageOttawaPaiutePakistaniPalestinianPanamanianParaguayanPennsylvania GermanPeruvianPimaPolishPortuguesePotawatomiPuebloPuerto RicanPuget Sound SalishRomanianRussianSalvadoranSamoanScandinavianScotch-IrishScottishSeminoleSenegaleseSerbianShoshoneSierra LeoneanSiouxSlavicSlovakSloveneSomaliSouth AfricanSouth AmericanSouth American IndianSoviet UnionSpaniardSpanishSpanish AmericanSpanish American IndianSri LankanSubsaharan AfricanSudaneseSwedishSwissSyrianTaiwaneseThaiTlingit-HaidaTohono O'OdhamTonganTrinidadian and TobagonianTsimshianTurkishU.S. Virgin IslanderUgandanUkrainianUruguayanUteVenezuelanVietnameseWelshWest IndianYakamaYaquiYugoslavianYumanYup'ikZimbabwean
Immigration
NonimmigrantsImmigrantsAfghanistanAfricaAlbaniaArgentinaArmeniaAsiaAustraliaAustriaBahamasBangladeshBarbadosBelarusBelgiumBelizeBoliviaBosnia and HerzegovinaBrazilBulgariaBurma/MyanmarCabo VerdeCambodiaCameroonCanadaCaribbeanCentral AmericaChileChinaColombiaCongoCosta RicaCroatiaCubaCzechoslovakiaDenmarkDominicaDominican RepublicEastern AfricaEastern AsiaEastern EuropeEcuadorEgyptEl SalvadorEnglandEritreaEthiopiaEuropeFijiFranceGermanyGhanaGreeceGrenadaGuatemalaGuyanaHaitiHondurasHong KongHungaryIndiaIndonesiaIranIraqIrelandIsraelItalyJamaicaJapanJordanKazakhstanKenyaKoreaKuwaitLaosLatin AmericaLatviaLebanonLiberiaLithuaniaMalaysiaMexicoMicronesiaMiddle AfricaMoldovaMoroccoNepalNetherlandsNicaraguaNigeriaNorth AmericaNorth MacedoniaNorthern AfricaNorthern EuropeNorwayOceaniaPakistanPanamaPeruPhilippinesPolandPortugalRomaniaRussiaSaudi ArabiaScotlandSenegalSerbiaSierra LeoneSingaporeSomaliaSouth AfricaSouth AmericaSouth Central AsiaSouth Eastern AsiaSouthern EuropeSpainSri LankaSt. Vincent and the GrenadinesSudanSwedenSwitzerlandSyriaTaiwanThailandTrinidad and TobagoTurkeyUgandaUkraineUruguayUzbekistanVenezuelaVietnamWest IndiesWestern AfricaWestern AsiaWestern EuropeYemenZaireZimbabweAzores
Select to Compare
Race
Ancestry
AfghanAfricanAlaska NativeAlaskan AthabascanAlbanianAleutAlsatianAmericanApacheArabArapahoArgentineanArmenianAssyrian/Chaldean/SyriacAustralianAustrianBahamianBangladeshiBarbadianBasqueBelgianBelizeanBermudanBhutaneseBlackfeetBolivianBrazilianBritishBritish West IndianBulgarianBurmeseCajunCambodianCanadianCape VerdeanCarpatho RusynCelticCentral AmericanCentral American IndianCherokeeCheyenneChickasawChileanChineseChippewaChoctawColombianColvilleComancheCosta RicanCreeCreekCroatianCrowCubanCypriotCzechCzechoslovakianDanishDelawareDominicanDutchDutch West IndianEastern EuropeanEcuadorianEgyptianEnglishEstonianEthiopianEuropeanFijianFilipinoFinnishFrenchFrench American IndianFrench CanadianGermanGerman RussianGhanaianGreekGuamanian/ChamorroGuatemalanGuyaneseHaitianHmongHonduranHopiHungarianIcelanderIndian (Asian)IndonesianInupiatIranianIraqiIrishIroquoisIsraeliItalianJamaicanJapaneseJordanianKenyanKiowaKoreanLaotianLatvianLebaneseLiberianLithuanianLumbeeLuxembourgerMacedonianMalaysianMalteseMarshalleseMenomineeMexicanMexican American IndianMongolianMoroccanNative HawaiianNavajoNepaleseNew ZealanderNicaraguanNigerianNorthern EuropeanNorwegianOkinawanOsageOttawaPaiutePakistaniPalestinianPanamanianParaguayanPennsylvania GermanPeruvianPimaPolishPortuguesePotawatomiPuebloPuerto RicanPuget Sound SalishRomanianRussianSalvadoranSamoanScandinavianScotch-IrishScottishSeminoleSenegaleseSerbianShoshoneSierra LeoneanSiouxSlavicSlovakSloveneSomaliSouth AfricanSouth AmericanSouth American IndianSoviet UnionSpaniardSpanishSpanish AmericanSpanish American IndianSri LankanSubsaharan AfricanSudaneseSwedishSwissSyrianTaiwaneseThaiTlingit-HaidaTohono O'OdhamTonganTrinidadian and TobagonianTsimshianTurkishU.S. Virgin IslanderUgandanUkrainianUruguayanUteVenezuelanVietnameseWelshWest IndianYakamaYaquiYugoslavianYumanYup'ikZimbabwean
Immigration
NonimmigrantsImmigrantsAfghanistanAfricaAlbaniaArgentinaArmeniaAsiaAustraliaAustriaBahamasBangladeshBarbadosBelarusBelgiumBelizeBoliviaBosnia and HerzegovinaBrazilBulgariaBurma/MyanmarCabo VerdeCambodiaCameroonCanadaCaribbeanCentral AmericaChileChinaColombiaCongoCosta RicaCroatiaCubaCzechoslovakiaDenmarkDominicaDominican RepublicEastern AfricaEastern AsiaEastern EuropeEcuadorEgyptEl SalvadorEnglandEritreaEthiopiaEuropeFijiFranceGermanyGhanaGreeceGrenadaGuatemalaGuyanaHaitiHondurasHong KongHungaryIndiaIndonesiaIranIraqIrelandIsraelItalyJamaicaJapanJordanKazakhstanKenyaKoreaKuwaitLaosLatin AmericaLatviaLebanonLiberiaLithuaniaMalaysiaMexicoMicronesiaMiddle AfricaMoldovaMoroccoNepalNetherlandsNicaraguaNigeriaNorth AmericaNorth MacedoniaNorthern AfricaNorthern EuropeNorwayOceaniaPakistanPanamaPeruPhilippinesPolandPortugalRomaniaRussiaSaudi ArabiaScotlandSenegalSerbiaSierra LeoneSingaporeSomaliaSouth AfricaSouth AmericaSouth Central AsiaSouth Eastern AsiaSouthern EuropeSpainSri LankaSt. Vincent and the GrenadinesSudanSwedenSwitzerlandSyriaTaiwanThailandTrinidad and TobagoTurkeyUgandaUkraineUruguayUzbekistanVenezuelaVietnamWest IndiesWestern AfricaWestern AsiaWestern EuropeYemenZaireZimbabweAzores
4 or more Vehicles in Household
Income
Poverty
Unemployment
Labor Participation
Family Structure
Vehicle Availability
Education Level
Disability

Houma 4 or more Vehicles in Household
Tragic

4.9%
4+ VEHICLES AVAILABLE
0.0/ 100
METRIC RATING
311th/ 347
METRIC RANK

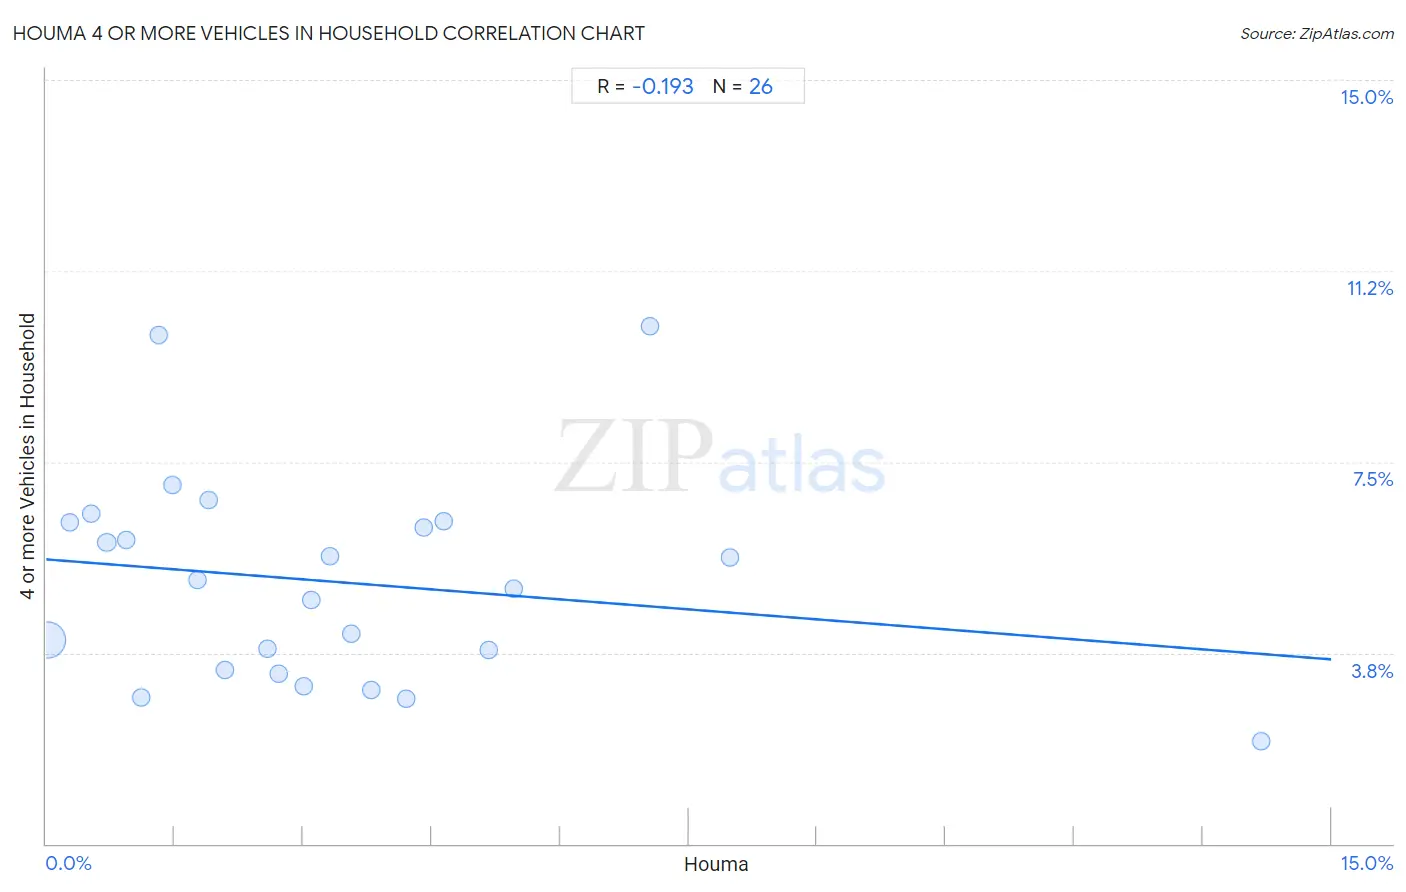
Houma 4 or more Vehicles in Household Correlation Chart

The statistical analysis conducted on geographies consisting of 36,738,728 people shows a poor negative correlation between the proportion of Houma and percentage of households with 4 or more vehicles available in the United States with a correlation coefficient (R) of -0.193 and weighted average of 4.9%. On average, for every 1% (one percent) increase in Houma within a typical geography, there is a decrease of 0.13% in percentage of households with 4 or more vehicles available.
Houma 4 or more Vehicles in Household
It is essential to understand that the correlation between the percentage of Houma and percentage of households with 4 or more vehicles available does not imply a direct cause-and-effect relationship. It remains uncertain whether the presence of Houma influences an upward or downward trend in the level of percentage of households with 4 or more vehicles available within an area, or if Houma simply ended up residing in those areas with higher or lower levels of percentage of households with 4 or more vehicles available due to other factors.

Demographics Similar to Houma by 4 or more Vehicles in Household

In terms of 4 or more vehicles in household, the demographic groups most similar to Houma are Moroccan (4.9%, a difference of 0.010%), Immigrants from Somalia (4.9%, a difference of 0.39%), Paraguayan (4.9%, a difference of 0.54%), Menominee (5.0%, a difference of 1.3%), and Immigrants from Serbia (5.0%, a difference of 2.2%).
DemographicsRating | Rank4 or more Vehicles in Household
Cypriots
0.0
/100
|
#304
Tragic
5.0%
Somalis
0.0
/100
|
#305
Tragic
5.0%
Immigrants from Serbia
0.0
/100
|
#306
Tragic
5.0%
Menominee
0.0
/100
|
#307
Tragic
5.0%
Paraguayans
0.0
/100
|
#308
Tragic
4.9%
Immigrants from Somalia
0.0
/100
|
#309
Tragic
4.9%
Moroccans
0.0
/100
|
#310
Tragic
4.9%
Houma
0.0
/100
|
#311
Tragic
4.9%
Albanians
0.0
/100
|
#312
Tragic
4.8%
Immigrants from Israel
0.0
/100
|
#313
Tragic
4.8%
Immigrants from West Indies
0.0
/100
|
#314
Tragic
4.7%
Immigrants from Belarus
0.0
/100
|
#315
Tragic
4.7%
Puerto Ricans
0.0
/100
|
#316
Tragic
4.7%
U.S. Virgin Islanders
0.0
/100
|
#317
Tragic
4.6%
Jamaicans
0.0
/100
|
#318
Tragic
4.6%

Houma 4 or more Vehicles in Household Correlation Summary

MeasurementHouma Data4 or more Vehicles in Household Data
Minimum0.012%2.0%
Maximum14.2%10.2%
Range14.2%8.2%
Mean3.4%5.1%
Median2.9%5.1%
Interquartile 25% (IQ1)1.3%3.4%
Interquartile 75% (IQ3)4.4%6.3%
Interquartile Range (IQR)3.1%2.9%
Standard Deviation (Sample)3.0%2.0%
Standard Deviation (Population)2.9%2.0%

Correlation Details

Houma PercentileSample Size4 or more Vehicles in Household
[
0.0%
-
0.5%
]
0.012%
35,210,8344.0%
[
0.0%
-
0.5%
]
0.28%
568,5196.3%
[
0.5%
-
1.0%
]
0.52%
304,5706.5%
[
0.5%
-
1.0%
]
0.71%
264,9005.9%
[
0.5%
-
1.0%
]
0.93%
85,9496.0%
[
1.0%
-
1.5%
]
1.10%
43,2302.9%
[
1.0%
-
1.5%
]
1.32%
4,54510.0%
[
1.0%
-
1.5%
]
1.47%
25,0877.0%
[
1.5%
-
2.0%
]
1.77%
15,0315.2%
[
1.5%
-
2.0%
]
1.89%
11,4156.7%
[
2.0%
-
2.5%
]
2.09%
8,6003.4%
[
2.5%
-
3.0%
]
2.58%
9,2873.8%
[
2.5%
-
3.0%
]
2.71%
7,9613.3%
[
3.0%
-
3.5%
]
3.00%
25,7423.1%
[
3.0%
-
3.5%
]
3.09%
5,1184.8%
[
3.0%
-
3.5%
]
3.31%
5,6775.6%
[
3.5%
-
4.0%
]
3.56%
33,0944.1%
[
3.5%
-
4.0%
]
3.79%
15,3733.0%
[
4.0%
-
4.5%
]
4.21%
11,6242.9%
[
4.0%
-
4.5%
]
4.40%
2,3866.2%
[
4.5%
-
5.0%
]
4.63%
30,1926.3%
[
5.0%
-
5.5%
]
5.16%
35,7603.8%
[
5.0%
-
5.5%
]
5.46%
5,8455.0%
[
7.0%
-
7.5%
]
7.04%
3,76210.2%
[
7.5%
-
8.0%
]
7.99%
2,8805.6%
[
14.0%
-
14.5%
]
14.18%
1,3472.0%