Palestinian 4 or more Vehicles in Household
COMPARE
Palestinian
Select to Compare
4 or more Vehicles in Household
Palestinian 4 or more Vehicles in Household
6.4%
4+ VEHICLES AVAILABLE
65.8/ 100
METRIC RATING
160th/ 347
METRIC RANK
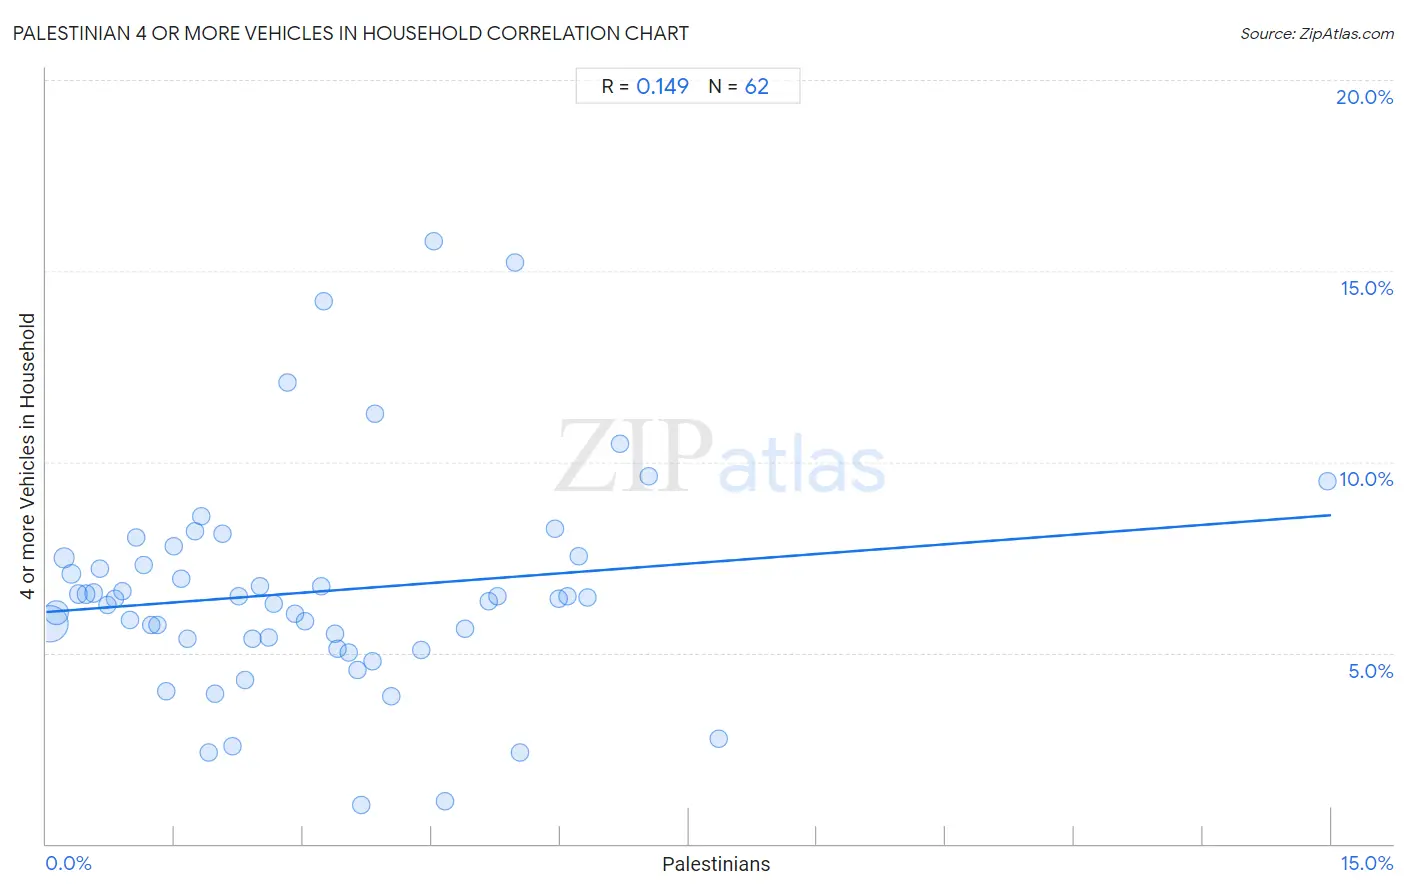
Palestinian 4 or more Vehicles in Household Correlation Chart
The statistical analysis conducted on geographies consisting of 215,710,656 people shows a poor positive correlation between the proportion of Palestinians and percentage of households with 4 or more vehicles available in the United States with a correlation coefficient (R) of 0.149 and weighted average of 6.4%. On average, for every 1% (one percent) increase in Palestinians within a typical geography, there is an increase of 0.17% in percentage of households with 4 or more vehicles available.
It is essential to understand that the correlation between the percentage of Palestinians and percentage of households with 4 or more vehicles available does not imply a direct cause-and-effect relationship. It remains uncertain whether the presence of Palestinians influences an upward or downward trend in the level of percentage of households with 4 or more vehicles available within an area, or if Palestinians simply ended up residing in those areas with higher or lower levels of percentage of households with 4 or more vehicles available due to other factors.
Demographics Similar to Palestinians by 4 or more Vehicles in Household
In terms of 4 or more vehicles in household, the demographic groups most similar to Palestinians are Indian (Asian) (6.4%, a difference of 0.050%), Zimbabwean (6.4%, a difference of 0.15%), Immigrants from Cameroon (6.4%, a difference of 0.15%), Immigrants from Pakistan (6.4%, a difference of 0.28%), and Peruvian (6.5%, a difference of 0.41%).
| Demographics | Rating | Rank | 4 or more Vehicles in Household |
| Immigrants from Armenia | 71.2 /100 | #153 | Good 6.5% |
| Central American Indians | 71.1 /100 | #154 | Good 6.5% |
| Iroquois | 70.4 /100 | #155 | Good 6.5% |
| Iranians | 69.9 /100 | #156 | Good 6.5% |
| Peruvians | 69.4 /100 | #157 | Good 6.5% |
| Zimbabweans | 67.1 /100 | #158 | Good 6.4% |
| Indians (Asian) | 66.3 /100 | #159 | Good 6.4% |
| Palestinians | 65.8 /100 | #160 | Good 6.4% |
| Immigrants from Cameroon | 64.4 /100 | #161 | Good 6.4% |
| Immigrants from Pakistan | 63.2 /100 | #162 | Good 6.4% |
| Chileans | 61.2 /100 | #163 | Good 6.4% |
| Hungarians | 61.1 /100 | #164 | Good 6.4% |
| Immigrants from Peru | 59.8 /100 | #165 | Average 6.4% |
| Immigrants from Denmark | 57.8 /100 | #166 | Average 6.4% |
| Poles | 56.9 /100 | #167 | Average 6.4% |
Palestinian 4 or more Vehicles in Household Correlation Summary
| Measurement | Palestinian Data | 4 or more Vehicles in Household Data |
| Minimum | 0.038% | 1.0% |
| Maximum | 15.0% | 15.8% |
| Range | 14.9% | 14.8% |
| Mean | 3.1% | 6.6% |
| Median | 2.6% | 6.4% |
| Interquartile 25% (IQ1) | 1.3% | 5.4% |
| Interquartile 75% (IQ3) | 4.5% | 7.5% |
| Interquartile Range (IQR) | 3.2% | 2.1% |
| Standard Deviation (Sample) | 2.5% | 2.9% |
| Standard Deviation (Population) | 2.5% | 2.8% |
Correlation Details
| Palestinian Percentile | Sample Size | 4 or more Vehicles in Household |
[ 0.0% - 0.5% ] 0.038% | 135,896,665 | 5.8% |
[ 0.0% - 0.5% ] 0.12% | 42,493,651 | 6.0% |
[ 0.0% - 0.5% ] 0.21% | 12,679,633 | 7.5% |
[ 0.0% - 0.5% ] 0.29% | 7,866,714 | 7.1% |
[ 0.0% - 0.5% ] 0.38% | 4,895,993 | 6.5% |
[ 0.0% - 0.5% ] 0.47% | 2,803,704 | 6.5% |
[ 0.5% - 1.0% ] 0.55% | 1,739,342 | 6.6% |
[ 0.5% - 1.0% ] 0.63% | 1,392,422 | 7.2% |
[ 0.5% - 1.0% ] 0.71% | 1,107,617 | 6.3% |
[ 0.5% - 1.0% ] 0.80% | 494,913 | 6.4% |
[ 0.5% - 1.0% ] 0.90% | 801,883 | 6.6% |
[ 0.5% - 1.0% ] 0.98% | 533,657 | 5.9% |
[ 1.0% - 1.5% ] 1.05% | 370,356 | 8.0% |
[ 1.0% - 1.5% ] 1.14% | 269,854 | 7.3% |
[ 1.0% - 1.5% ] 1.22% | 257,921 | 5.7% |
[ 1.0% - 1.5% ] 1.30% | 452,606 | 5.7% |
[ 1.0% - 1.5% ] 1.40% | 53,323 | 4.0% |
[ 1.0% - 1.5% ] 1.48% | 94,511 | 7.8% |
[ 1.5% - 2.0% ] 1.57% | 210,045 | 6.9% |
[ 1.5% - 2.0% ] 1.65% | 195,446 | 5.4% |
[ 1.5% - 2.0% ] 1.73% | 52,070 | 8.2% |
[ 1.5% - 2.0% ] 1.80% | 69,876 | 8.6% |
[ 1.5% - 2.0% ] 1.89% | 88,001 | 2.4% |
[ 1.5% - 2.0% ] 1.97% | 58,533 | 3.9% |
[ 2.0% - 2.5% ] 2.06% | 104,816 | 8.1% |
[ 2.0% - 2.5% ] 2.18% | 37,319 | 2.6% |
[ 2.0% - 2.5% ] 2.24% | 11,815 | 6.5% |
[ 2.0% - 2.5% ] 2.32% | 42,595 | 4.3% |
[ 2.0% - 2.5% ] 2.41% | 91,289 | 5.4% |
[ 2.0% - 2.5% ] 2.50% | 76,650 | 6.8% |
[ 2.5% - 3.0% ] 2.60% | 14,176 | 5.4% |
[ 2.5% - 3.0% ] 2.66% | 10,859 | 6.3% |
[ 2.5% - 3.0% ] 2.82% | 7,946 | 12.1% |
[ 2.5% - 3.0% ] 2.91% | 22,318 | 6.0% |
[ 3.0% - 3.5% ] 3.02% | 34,224 | 5.8% |
[ 3.0% - 3.5% ] 3.21% | 68,870 | 6.7% |
[ 3.0% - 3.5% ] 3.24% | 2,222 | 14.2% |
[ 3.0% - 3.5% ] 3.37% | 4,830 | 5.5% |
[ 3.0% - 3.5% ] 3.40% | 36,556 | 5.1% |
[ 3.5% - 4.0% ] 3.53% | 14,360 | 5.0% |
[ 3.5% - 4.0% ] 3.64% | 43,709 | 4.5% |
[ 3.5% - 4.0% ] 3.68% | 2,090 | 1.0% |
[ 3.5% - 4.0% ] 3.81% | 4,018 | 4.8% |
[ 3.5% - 4.0% ] 3.83% | 8,065 | 11.3% |
[ 4.0% - 4.5% ] 4.03% | 23,437 | 3.9% |
[ 4.0% - 4.5% ] 4.37% | 5,121 | 5.1% |
[ 4.5% - 5.0% ] 4.53% | 11,787 | 15.8% |
[ 4.5% - 5.0% ] 4.66% | 794 | 1.1% |
[ 4.5% - 5.0% ] 4.89% | 3,050 | 5.6% |
[ 5.0% - 5.5% ] 5.16% | 3,447 | 6.4% |
[ 5.0% - 5.5% ] 5.27% | 3,379 | 6.5% |
[ 5.0% - 5.5% ] 5.47% | 4,222 | 15.2% |
[ 5.5% - 6.0% ] 5.54% | 2,059 | 2.4% |
[ 5.5% - 6.0% ] 5.93% | 26,198 | 8.2% |
[ 5.5% - 6.0% ] 5.98% | 14,915 | 6.4% |
[ 6.0% - 6.5% ] 6.09% | 14,650 | 6.5% |
[ 6.0% - 6.5% ] 6.22% | 46,933 | 7.5% |
[ 6.0% - 6.5% ] 6.31% | 16,939 | 6.4% |
[ 6.5% - 7.0% ] 6.70% | 2,970 | 10.5% |
[ 7.0% - 7.5% ] 7.03% | 5,022 | 9.6% |
[ 7.5% - 8.0% ] 7.84% | 1,428 | 2.8% |
[ 14.5% - 15.0% ] 14.95% | 6,842 | 9.5% |