Spanish American 4 or more Vehicles in Household

COMPARE

Spanish American
Race
Ancestry
AfghanAfricanAlaska NativeAlaskan AthabascanAlbanianAleutAlsatianAmericanApacheArabArapahoArgentineanArmenianAssyrian/Chaldean/SyriacAustralianAustrianBahamianBangladeshiBarbadianBasqueBelgianBelizeanBermudanBhutaneseBlackfeetBolivianBrazilianBritishBritish West IndianBulgarianBurmeseCajunCambodianCanadianCape VerdeanCarpatho RusynCelticCentral AmericanCentral American IndianCherokeeCheyenneChickasawChileanChineseChippewaChoctawColombianColvilleComancheCosta RicanCreeCreekCroatianCrowCubanCypriotCzechCzechoslovakianDanishDelawareDominicanDutchDutch West IndianEastern EuropeanEcuadorianEgyptianEnglishEstonianEthiopianEuropeanFijianFilipinoFinnishFrenchFrench American IndianFrench CanadianGermanGerman RussianGhanaianGreekGuamanian/ChamorroGuatemalanGuyaneseHaitianHmongHonduranHopiHoumaHungarianIcelanderIndian (Asian)IndonesianInupiatIranianIraqiIrishIroquoisIsraeliItalianJamaicanJapaneseJordanianKenyanKiowaKoreanLaotianLatvianLebaneseLiberianLithuanianLumbeeLuxembourgerMacedonianMalaysianMalteseMarshalleseMenomineeMexicanMexican American IndianMongolianMoroccanNative HawaiianNavajoNepaleseNew ZealanderNicaraguanNigerianNorthern EuropeanNorwegianOkinawanOsageOttawaPaiutePakistaniPalestinianPanamanianParaguayanPennsylvania GermanPeruvianPimaPolishPortuguesePotawatomiPuebloPuerto RicanPuget Sound SalishRomanianRussianSalvadoranSamoanScandinavianScotch-IrishScottishSeminoleSenegaleseSerbianShoshoneSierra LeoneanSiouxSlavicSlovakSloveneSomaliSouth AfricanSouth AmericanSouth American IndianSoviet UnionSpaniardSpanishSpanish AmericanSpanish American IndianSri LankanSubsaharan AfricanSudaneseSwedishSwissSyrianTaiwaneseThaiTlingit-HaidaTohono O'OdhamTonganTrinidadian and TobagonianTsimshianTurkishU.S. Virgin IslanderUgandanUkrainianUruguayanUteVenezuelanVietnameseWelshWest IndianYakamaYaquiYugoslavianYumanYup'ikZimbabwean
Immigration
NonimmigrantsImmigrantsAfghanistanAfricaAlbaniaArgentinaArmeniaAsiaAustraliaAustriaBahamasBangladeshBarbadosBelarusBelgiumBelizeBoliviaBosnia and HerzegovinaBrazilBulgariaBurma/MyanmarCabo VerdeCambodiaCameroonCanadaCaribbeanCentral AmericaChileChinaColombiaCongoCosta RicaCroatiaCubaCzechoslovakiaDenmarkDominicaDominican RepublicEastern AfricaEastern AsiaEastern EuropeEcuadorEgyptEl SalvadorEnglandEritreaEthiopiaEuropeFijiFranceGermanyGhanaGreeceGrenadaGuatemalaGuyanaHaitiHondurasHong KongHungaryIndiaIndonesiaIranIraqIrelandIsraelItalyJamaicaJapanJordanKazakhstanKenyaKoreaKuwaitLaosLatin AmericaLatviaLebanonLiberiaLithuaniaMalaysiaMexicoMicronesiaMiddle AfricaMoldovaMoroccoNepalNetherlandsNicaraguaNigeriaNorth AmericaNorth MacedoniaNorthern AfricaNorthern EuropeNorwayOceaniaPakistanPanamaPeruPhilippinesPolandPortugalRomaniaRussiaSaudi ArabiaScotlandSenegalSerbiaSierra LeoneSingaporeSomaliaSouth AfricaSouth AmericaSouth Central AsiaSouth Eastern AsiaSouthern EuropeSpainSri LankaSt. Vincent and the GrenadinesSudanSwedenSwitzerlandSyriaTaiwanThailandTrinidad and TobagoTurkeyUgandaUkraineUruguayUzbekistanVenezuelaVietnamWest IndiesWestern AfricaWestern AsiaWestern EuropeYemenZaireZimbabweAzores
Select to Compare
Race
Ancestry
AfghanAfricanAlaska NativeAlaskan AthabascanAlbanianAleutAlsatianAmericanApacheArabArapahoArgentineanArmenianAssyrian/Chaldean/SyriacAustralianAustrianBahamianBangladeshiBarbadianBasqueBelgianBelizeanBermudanBhutaneseBlackfeetBolivianBrazilianBritishBritish West IndianBulgarianBurmeseCajunCambodianCanadianCape VerdeanCarpatho RusynCelticCentral AmericanCentral American IndianCherokeeCheyenneChickasawChileanChineseChippewaChoctawColombianColvilleComancheCosta RicanCreeCreekCroatianCrowCubanCypriotCzechCzechoslovakianDanishDelawareDominicanDutchDutch West IndianEastern EuropeanEcuadorianEgyptianEnglishEstonianEthiopianEuropeanFijianFilipinoFinnishFrenchFrench American IndianFrench CanadianGermanGerman RussianGhanaianGreekGuamanian/ChamorroGuatemalanGuyaneseHaitianHmongHonduranHopiHoumaHungarianIcelanderIndian (Asian)IndonesianInupiatIranianIraqiIrishIroquoisIsraeliItalianJamaicanJapaneseJordanianKenyanKiowaKoreanLaotianLatvianLebaneseLiberianLithuanianLumbeeLuxembourgerMacedonianMalaysianMalteseMarshalleseMenomineeMexicanMexican American IndianMongolianMoroccanNative HawaiianNavajoNepaleseNew ZealanderNicaraguanNigerianNorthern EuropeanNorwegianOkinawanOsageOttawaPaiutePakistaniPalestinianPanamanianParaguayanPennsylvania GermanPeruvianPimaPolishPortuguesePotawatomiPuebloPuerto RicanPuget Sound SalishRomanianRussianSalvadoranSamoanScandinavianScotch-IrishScottishSeminoleSenegaleseSerbianShoshoneSierra LeoneanSiouxSlavicSlovakSloveneSomaliSouth AfricanSouth AmericanSouth American IndianSoviet UnionSpaniardSpanishSpanish American IndianSri LankanSubsaharan AfricanSudaneseSwedishSwissSyrianTaiwaneseThaiTlingit-HaidaTohono O'OdhamTonganTrinidadian and TobagonianTsimshianTurkishU.S. Virgin IslanderUgandanUkrainianUruguayanUteVenezuelanVietnameseWelshWest IndianYakamaYaquiYugoslavianYumanYup'ikZimbabwean
Immigration
NonimmigrantsImmigrantsAfghanistanAfricaAlbaniaArgentinaArmeniaAsiaAustraliaAustriaBahamasBangladeshBarbadosBelarusBelgiumBelizeBoliviaBosnia and HerzegovinaBrazilBulgariaBurma/MyanmarCabo VerdeCambodiaCameroonCanadaCaribbeanCentral AmericaChileChinaColombiaCongoCosta RicaCroatiaCubaCzechoslovakiaDenmarkDominicaDominican RepublicEastern AfricaEastern AsiaEastern EuropeEcuadorEgyptEl SalvadorEnglandEritreaEthiopiaEuropeFijiFranceGermanyGhanaGreeceGrenadaGuatemalaGuyanaHaitiHondurasHong KongHungaryIndiaIndonesiaIranIraqIrelandIsraelItalyJamaicaJapanJordanKazakhstanKenyaKoreaKuwaitLaosLatin AmericaLatviaLebanonLiberiaLithuaniaMalaysiaMexicoMicronesiaMiddle AfricaMoldovaMoroccoNepalNetherlandsNicaraguaNigeriaNorth AmericaNorth MacedoniaNorthern AfricaNorthern EuropeNorwayOceaniaPakistanPanamaPeruPhilippinesPolandPortugalRomaniaRussiaSaudi ArabiaScotlandSenegalSerbiaSierra LeoneSingaporeSomaliaSouth AfricaSouth AmericaSouth Central AsiaSouth Eastern AsiaSouthern EuropeSpainSri LankaSt. Vincent and the GrenadinesSudanSwedenSwitzerlandSyriaTaiwanThailandTrinidad and TobagoTurkeyUgandaUkraineUruguayUzbekistanVenezuelaVietnamWest IndiesWestern AfricaWestern AsiaWestern EuropeYemenZaireZimbabweAzores
4 or more Vehicles in Household
Income
Poverty
Unemployment
Labor Participation
Family Structure
Vehicle Availability
Education Level
Disability

Spanish American 4 or more Vehicles in Household
Exceptional

8.0%
4+ VEHICLES AVAILABLE
100.0/ 100
METRIC RATING
39th/ 347
METRIC RANK

Spanish American 4 or more Vehicles in Household Correlation Chart

The statistical analysis conducted on geographies consisting of 102,996,675 people shows a substantial positive correlation between the proportion of Spanish Americans and percentage of households with 4 or more vehicles available in the United States with a correlation coefficient (R) of 0.591 and weighted average of 8.0%. On average, for every 1% (one percent) increase in Spanish Americans within a typical geography, there is an increase of 0.77% in percentage of households with 4 or more vehicles available.
Spanish American 4 or more Vehicles in Household
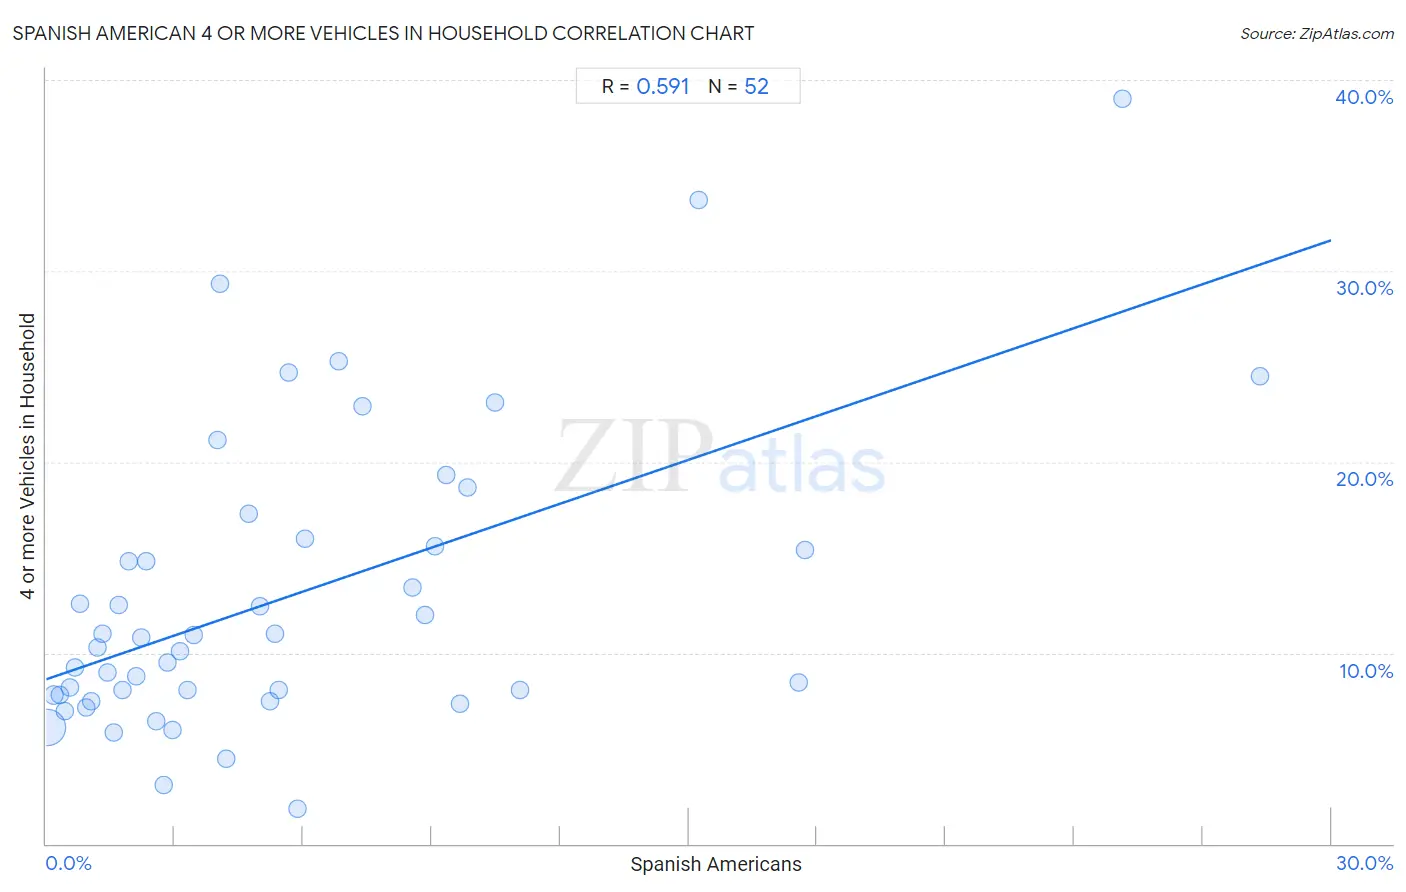
It is essential to understand that the correlation between the percentage of Spanish Americans and percentage of households with 4 or more vehicles available does not imply a direct cause-and-effect relationship. It remains uncertain whether the presence of Spanish Americans influences an upward or downward trend in the level of percentage of households with 4 or more vehicles available within an area, or if Spanish Americans simply ended up residing in those areas with higher or lower levels of percentage of households with 4 or more vehicles available due to other factors.

Demographics Similar to Spanish Americans by 4 or more Vehicles in Household

In terms of 4 or more vehicles in household, the demographic groups most similar to Spanish Americans are Sioux (8.0%, a difference of 0.22%), Scandinavian (8.0%, a difference of 0.26%), Norwegian (8.0%, a difference of 0.43%), Spanish (7.9%, a difference of 0.63%), and Pima (7.9%, a difference of 1.2%).
DemographicsRating | Rank4 or more Vehicles in Household
Marshallese
100.0
/100
|
#32
Exceptional
8.1%
Yaqui
100.0
/100
|
#33
Exceptional
8.1%
Alaskan Athabascans
100.0
/100
|
#34
Exceptional
8.1%
Guamanians/Chamorros
100.0
/100
|
#35
Exceptional
8.1%
Norwegians
100.0
/100
|
#36
Exceptional
8.0%
Scandinavians
100.0
/100
|
#37
Exceptional
8.0%
Sioux
100.0
/100
|
#38
Exceptional
8.0%
Spanish Americans
100.0
/100
|
#39
Exceptional
8.0%
Spanish
100.0
/100
|
#40
Exceptional
7.9%
Pima
100.0
/100
|
#41
Exceptional
7.9%
Salvadorans
100.0
/100
|
#42
Exceptional
7.8%
Fijians
100.0
/100
|
#43
Exceptional
7.8%
Bhutanese
100.0
/100
|
#44
Exceptional
7.8%
Choctaw
100.0
/100
|
#45
Exceptional
7.8%
Crow
100.0
/100
|
#46
Exceptional
7.8%

Spanish American 4 or more Vehicles in Household Correlation Summary

MeasurementSpanish American Data4 or more Vehicles in Household Data
Minimum0.023%1.8%
Maximum28.3%39.0%
Range28.3%37.2%
Mean5.7%12.9%
Median3.7%10.5%
Interquartile 25% (IQ1)1.6%7.8%
Interquartile 75% (IQ3)8.0%15.8%
Interquartile Range (IQR)6.3%8.0%
Standard Deviation (Sample)6.0%7.8%
Standard Deviation (Population)6.0%7.7%

Correlation Details

Spanish American PercentileSample Size4 or more Vehicles in Household
[
0.0%
-
0.5%
]
0.023%
92,506,8356.1%
[
0.0%
-
0.5%
]
0.17%
5,494,4057.8%
[
0.0%
-
0.5%
]
0.32%
1,665,3097.8%
[
0.0%
-
0.5%
]
0.44%
1,672,1226.9%
[
0.5%
-
1.0%
]
0.55%
466,2168.2%
[
0.5%
-
1.0%
]
0.68%
294,8029.2%
[
0.5%
-
1.0%
]
0.80%
228,37012.6%
[
0.5%
-
1.0%
]
0.95%
72,5347.1%
[
1.0%
-
1.5%
]
1.05%
169,7727.4%
[
1.0%
-
1.5%
]
1.21%
110,12310.3%
[
1.0%
-
1.5%
]
1.31%
45,17211.0%
[
1.0%
-
1.5%
]
1.43%
63,2428.9%
[
1.5%
-
2.0%
]
1.59%
38,7055.8%
[
1.5%
-
2.0%
]
1.69%
11,41812.5%
[
1.5%
-
2.0%
]
1.78%
25,2188.1%
[
1.5%
-
2.0%
]
1.94%
2,16514.8%
[
2.0%
-
2.5%
]
2.09%
13,4278.8%
[
2.0%
-
2.5%
]
2.21%
15,72310.8%
[
2.0%
-
2.5%
]
2.32%
11,05614.8%
[
2.5%
-
3.0%
]
2.58%
9,1656.4%
[
2.5%
-
3.0%
]
2.75%
1,0193.1%
[
2.5%
-
3.0%
]
2.82%
8,0839.5%
[
2.5%
-
3.0%
]
2.96%
5,5715.9%
[
3.0%
-
3.5%
]
3.11%
7,20310.1%
[
3.0%
-
3.5%
]
3.29%
4,1368.1%
[
3.0%
-
3.5%
]
3.44%
6,78111.0%
[
3.5%
-
4.0%
]
3.99%
3,53621.1%
[
4.0%
-
4.5%
]
4.05%
4,34729.3%
[
4.0%
-
4.5%
]
4.20%
1,9534.5%
[
4.5%
-
5.0%
]
4.73%
2,49617.3%
[
4.5%
-
5.0%
]
4.99%
2,34412.4%
[
5.0%
-
5.5%
]
5.21%
2,3987.4%
[
5.0%
-
5.5%
]
5.33%
1,50111.0%
[
5.0%
-
5.5%
]
5.42%
4,2248.1%
[
5.5%
-
6.0%
]
5.65%
2,95524.7%
[
5.5%
-
6.0%
]
5.86%
5,1561.8%
[
6.0%
-
6.5%
]
6.05%
38016.0%
[
6.5%
-
7.0%
]
6.84%
3,21725.2%
[
7.0%
-
7.5%
]
7.39%
1,38122.9%
[
8.5%
-
9.0%
]
8.54%
98413.4%
[
8.5%
-
9.0%
]
8.83%
63412.0%
[
9.0%
-
9.5%
]
9.09%
2,80615.6%
[
9.0%
-
9.5%
]
9.33%
2,44519.3%
[
9.5%
-
10.0%
]
9.65%
2287.4%
[
9.5%
-
10.0%
]
9.83%
35618.7%
[
10.0%
-
10.5%
]
10.46%
2,17923.1%
[
11.0%
-
11.5%
]
11.06%
2358.0%
[
15.0%
-
15.5%
]
15.23%
1,50433.7%
[
17.5%
-
18.0%
]
17.56%
4278.5%
[
17.5%
-
18.0%
]
17.72%
7915.4%
[
25.0%
-
25.5%
]
25.12%
21139.0%
[
28.0%
-
28.5%
]
28.35%
12724.5%