Cape Verdean 4 or more Vehicles in Household

COMPARE

Cape Verdean
Race
Ancestry
AfghanAfricanAlaska NativeAlaskan AthabascanAlbanianAleutAlsatianAmericanApacheArabArapahoArgentineanArmenianAssyrian/Chaldean/SyriacAustralianAustrianBahamianBangladeshiBarbadianBasqueBelgianBelizeanBermudanBhutaneseBlackfeetBolivianBrazilianBritishBritish West IndianBulgarianBurmeseCajunCambodianCanadianCape VerdeanCarpatho RusynCelticCentral AmericanCentral American IndianCherokeeCheyenneChickasawChileanChineseChippewaChoctawColombianColvilleComancheCosta RicanCreeCreekCroatianCrowCubanCypriotCzechCzechoslovakianDanishDelawareDominicanDutchDutch West IndianEastern EuropeanEcuadorianEgyptianEnglishEstonianEthiopianEuropeanFijianFilipinoFinnishFrenchFrench American IndianFrench CanadianGermanGerman RussianGhanaianGreekGuamanian/ChamorroGuatemalanGuyaneseHaitianHmongHonduranHopiHoumaHungarianIcelanderIndian (Asian)IndonesianInupiatIranianIraqiIrishIroquoisIsraeliItalianJamaicanJapaneseJordanianKenyanKiowaKoreanLaotianLatvianLebaneseLiberianLithuanianLumbeeLuxembourgerMacedonianMalaysianMalteseMarshalleseMenomineeMexicanMexican American IndianMongolianMoroccanNative HawaiianNavajoNepaleseNew ZealanderNicaraguanNigerianNorthern EuropeanNorwegianOkinawanOsageOttawaPaiutePakistaniPalestinianPanamanianParaguayanPennsylvania GermanPeruvianPimaPolishPortuguesePotawatomiPuebloPuerto RicanPuget Sound SalishRomanianRussianSalvadoranSamoanScandinavianScotch-IrishScottishSeminoleSenegaleseSerbianShoshoneSierra LeoneanSiouxSlavicSlovakSloveneSomaliSouth AfricanSouth AmericanSouth American IndianSoviet UnionSpaniardSpanishSpanish AmericanSpanish American IndianSri LankanSubsaharan AfricanSudaneseSwedishSwissSyrianTaiwaneseThaiTlingit-HaidaTohono O'OdhamTonganTrinidadian and TobagonianTsimshianTurkishU.S. Virgin IslanderUgandanUkrainianUruguayanUteVenezuelanVietnameseWelshWest IndianYakamaYaquiYugoslavianYumanYup'ikZimbabwean
Immigration
NonimmigrantsImmigrantsAfghanistanAfricaAlbaniaArgentinaArmeniaAsiaAustraliaAustriaBahamasBangladeshBarbadosBelarusBelgiumBelizeBoliviaBosnia and HerzegovinaBrazilBulgariaBurma/MyanmarCabo VerdeCambodiaCameroonCanadaCaribbeanCentral AmericaChileChinaColombiaCongoCosta RicaCroatiaCubaCzechoslovakiaDenmarkDominicaDominican RepublicEastern AfricaEastern AsiaEastern EuropeEcuadorEgyptEl SalvadorEnglandEritreaEthiopiaEuropeFijiFranceGermanyGhanaGreeceGrenadaGuatemalaGuyanaHaitiHondurasHong KongHungaryIndiaIndonesiaIranIraqIrelandIsraelItalyJamaicaJapanJordanKazakhstanKenyaKoreaKuwaitLaosLatin AmericaLatviaLebanonLiberiaLithuaniaMalaysiaMexicoMicronesiaMiddle AfricaMoldovaMoroccoNepalNetherlandsNicaraguaNigeriaNorth AmericaNorth MacedoniaNorthern AfricaNorthern EuropeNorwayOceaniaPakistanPanamaPeruPhilippinesPolandPortugalRomaniaRussiaSaudi ArabiaScotlandSenegalSerbiaSierra LeoneSingaporeSomaliaSouth AfricaSouth AmericaSouth Central AsiaSouth Eastern AsiaSouthern EuropeSpainSri LankaSt. Vincent and the GrenadinesSudanSwedenSwitzerlandSyriaTaiwanThailandTrinidad and TobagoTurkeyUgandaUkraineUruguayUzbekistanVenezuelaVietnamWest IndiesWestern AfricaWestern AsiaWestern EuropeYemenZaireZimbabweAzores
Select to Compare
Race
Ancestry
AfghanAfricanAlaska NativeAlaskan AthabascanAlbanianAleutAlsatianAmericanApacheArabArapahoArgentineanArmenianAssyrian/Chaldean/SyriacAustralianAustrianBahamianBangladeshiBarbadianBasqueBelgianBelizeanBermudanBhutaneseBlackfeetBolivianBrazilianBritishBritish West IndianBulgarianBurmeseCajunCambodianCanadianCarpatho RusynCelticCentral AmericanCentral American IndianCherokeeCheyenneChickasawChileanChineseChippewaChoctawColombianColvilleComancheCosta RicanCreeCreekCroatianCrowCubanCypriotCzechCzechoslovakianDanishDelawareDominicanDutchDutch West IndianEastern EuropeanEcuadorianEgyptianEnglishEstonianEthiopianEuropeanFijianFilipinoFinnishFrenchFrench American IndianFrench CanadianGermanGerman RussianGhanaianGreekGuamanian/ChamorroGuatemalanGuyaneseHaitianHmongHonduranHopiHoumaHungarianIcelanderIndian (Asian)IndonesianInupiatIranianIraqiIrishIroquoisIsraeliItalianJamaicanJapaneseJordanianKenyanKiowaKoreanLaotianLatvianLebaneseLiberianLithuanianLumbeeLuxembourgerMacedonianMalaysianMalteseMarshalleseMenomineeMexicanMexican American IndianMongolianMoroccanNative HawaiianNavajoNepaleseNew ZealanderNicaraguanNigerianNorthern EuropeanNorwegianOkinawanOsageOttawaPaiutePakistaniPalestinianPanamanianParaguayanPennsylvania GermanPeruvianPimaPolishPortuguesePotawatomiPuebloPuerto RicanPuget Sound SalishRomanianRussianSalvadoranSamoanScandinavianScotch-IrishScottishSeminoleSenegaleseSerbianShoshoneSierra LeoneanSiouxSlavicSlovakSloveneSomaliSouth AfricanSouth AmericanSouth American IndianSoviet UnionSpaniardSpanishSpanish AmericanSpanish American IndianSri LankanSubsaharan AfricanSudaneseSwedishSwissSyrianTaiwaneseThaiTlingit-HaidaTohono O'OdhamTonganTrinidadian and TobagonianTsimshianTurkishU.S. Virgin IslanderUgandanUkrainianUruguayanUteVenezuelanVietnameseWelshWest IndianYakamaYaquiYugoslavianYumanYup'ikZimbabwean
Immigration
NonimmigrantsImmigrantsAfghanistanAfricaAlbaniaArgentinaArmeniaAsiaAustraliaAustriaBahamasBangladeshBarbadosBelarusBelgiumBelizeBoliviaBosnia and HerzegovinaBrazilBulgariaBurma/MyanmarCabo VerdeCambodiaCameroonCanadaCaribbeanCentral AmericaChileChinaColombiaCongoCosta RicaCroatiaCubaCzechoslovakiaDenmarkDominicaDominican RepublicEastern AfricaEastern AsiaEastern EuropeEcuadorEgyptEl SalvadorEnglandEritreaEthiopiaEuropeFijiFranceGermanyGhanaGreeceGrenadaGuatemalaGuyanaHaitiHondurasHong KongHungaryIndiaIndonesiaIranIraqIrelandIsraelItalyJamaicaJapanJordanKazakhstanKenyaKoreaKuwaitLaosLatin AmericaLatviaLebanonLiberiaLithuaniaMalaysiaMexicoMicronesiaMiddle AfricaMoldovaMoroccoNepalNetherlandsNicaraguaNigeriaNorth AmericaNorth MacedoniaNorthern AfricaNorthern EuropeNorwayOceaniaPakistanPanamaPeruPhilippinesPolandPortugalRomaniaRussiaSaudi ArabiaScotlandSenegalSerbiaSierra LeoneSingaporeSomaliaSouth AfricaSouth AmericaSouth Central AsiaSouth Eastern AsiaSouthern EuropeSpainSri LankaSt. Vincent and the GrenadinesSudanSwedenSwitzerlandSyriaTaiwanThailandTrinidad and TobagoTurkeyUgandaUkraineUruguayUzbekistanVenezuelaVietnamWest IndiesWestern AfricaWestern AsiaWestern EuropeYemenZaireZimbabweAzores
4 or more Vehicles in Household
Income
Poverty
Unemployment
Labor Participation
Family Structure
Vehicle Availability
Education Level
Disability

Cape Verdean 4 or more Vehicles in Household
Tragic

4.4%
4+ VEHICLES AVAILABLE
0.0/ 100
METRIC RATING
326th/ 347
METRIC RANK

Cape Verdean 4 or more Vehicles in Household Correlation Chart

The statistical analysis conducted on geographies consisting of 107,262,408 people shows a slight negative correlation between the proportion of Cape Verdeans and percentage of households with 4 or more vehicles available in the United States with a correlation coefficient (R) of -0.077 and weighted average of 4.4%. On average, for every 1% (one percent) increase in Cape Verdeans within a typical geography, there is a decrease of 0.027% in percentage of households with 4 or more vehicles available.
Cape Verdean 4 or more Vehicles in Household
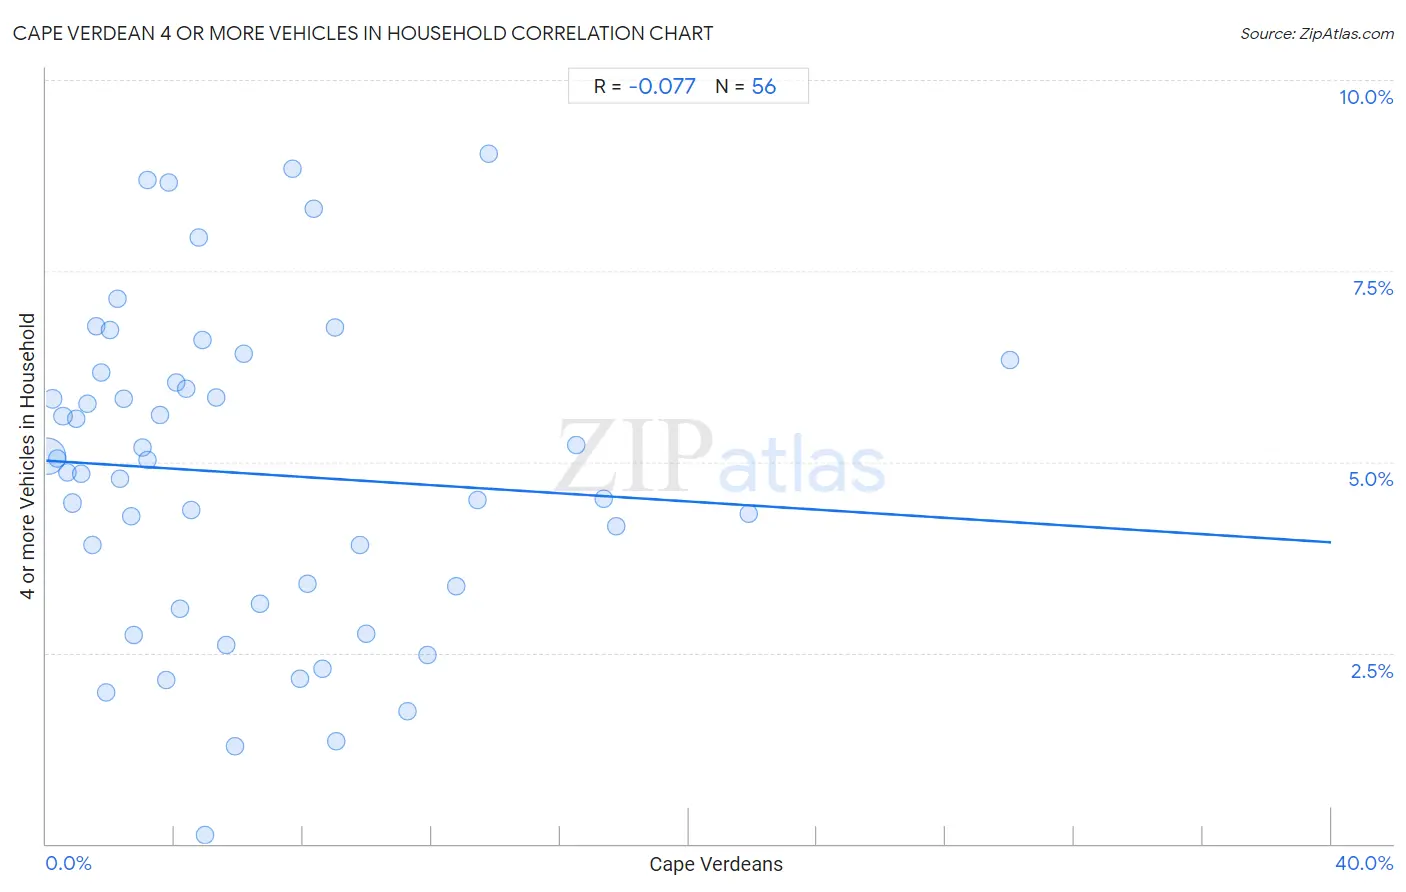
It is essential to understand that the correlation between the percentage of Cape Verdeans and percentage of households with 4 or more vehicles available does not imply a direct cause-and-effect relationship. It remains uncertain whether the presence of Cape Verdeans influences an upward or downward trend in the level of percentage of households with 4 or more vehicles available within an area, or if Cape Verdeans simply ended up residing in those areas with higher or lower levels of percentage of households with 4 or more vehicles available due to other factors.

Demographics Similar to Cape Verdeans by 4 or more Vehicles in Household

In terms of 4 or more vehicles in household, the demographic groups most similar to Cape Verdeans are Immigrants from Jamaica (4.4%, a difference of 0.32%), Soviet Union (4.4%, a difference of 0.64%), Immigrants from Caribbean (4.4%, a difference of 0.92%), Immigrants from Yemen (4.5%, a difference of 1.3%), and Ecuadorian (4.5%, a difference of 1.5%).
DemographicsRating | Rank4 or more Vehicles in Household
Haitians
0.0
/100
|
#319
Tragic
4.6%
Immigrants from Haiti
0.0
/100
|
#320
Tragic
4.5%
Ecuadorians
0.0
/100
|
#321
Tragic
4.5%
Immigrants from Yemen
0.0
/100
|
#322
Tragic
4.5%
Immigrants from Caribbean
0.0
/100
|
#323
Tragic
4.4%
Soviet Union
0.0
/100
|
#324
Tragic
4.4%
Immigrants from Jamaica
0.0
/100
|
#325
Tragic
4.4%
Cape Verdeans
0.0
/100
|
#326
Tragic
4.4%
Senegalese
0.0
/100
|
#327
Tragic
4.3%
Trinidadians and Tobagonians
0.0
/100
|
#328
Tragic
4.3%
Immigrants from Senegal
0.0
/100
|
#329
Tragic
4.2%
Immigrants from Ecuador
0.0
/100
|
#330
Tragic
4.2%
West Indians
0.0
/100
|
#331
Tragic
4.2%
Immigrants from Dominica
0.0
/100
|
#332
Tragic
4.2%
Immigrants from Albania
0.0
/100
|
#333
Tragic
4.1%

Cape Verdean 4 or more Vehicles in Household Correlation Summary

MeasurementCape Verdean Data4 or more Vehicles in Household Data
Minimum0.026%0.12%
Maximum30.0%9.0%
Range30.0%8.9%
Mean6.3%4.8%
Median4.4%4.9%
Interquartile 25% (IQ1)2.1%3.2%
Interquartile 75% (IQ3)8.8%6.1%
Interquartile Range (IQR)6.7%2.8%
Standard Deviation (Sample)6.0%2.1%
Standard Deviation (Population)5.9%2.1%

Correlation Details

Cape Verdean PercentileSample Size4 or more Vehicles in Household
[
0.0%
-
0.5%
]
0.026%
93,696,6185.1%
[
0.0%
-
0.5%
]
0.21%
5,661,9425.8%
[
0.0%
-
0.5%
]
0.35%
2,096,9355.0%
[
0.5%
-
1.0%
]
0.52%
1,131,1195.6%
[
0.5%
-
1.0%
]
0.67%
702,3044.9%
[
0.5%
-
1.0%
]
0.82%
453,7404.5%
[
0.5%
-
1.0%
]
0.93%
120,0465.6%
[
1.0%
-
1.5%
]
1.11%
280,3174.8%
[
1.0%
-
1.5%
]
1.28%
282,7295.8%
[
1.0%
-
1.5%
]
1.45%
353,0173.9%
[
1.5%
-
2.0%
]
1.56%
107,3236.8%
[
1.5%
-
2.0%
]
1.72%
159,1566.2%
[
1.5%
-
2.0%
]
1.88%
775,1562.0%
[
1.5%
-
2.0%
]
1.99%
60,2886.7%
[
2.0%
-
2.5%
]
2.20%
37,7897.1%
[
2.0%
-
2.5%
]
2.30%
22,3724.8%
[
2.0%
-
2.5%
]
2.42%
11,5095.8%
[
2.5%
-
3.0%
]
2.66%
128,7714.3%
[
2.5%
-
3.0%
]
2.71%
31,2142.7%
[
2.5%
-
3.0%
]
2.98%
59,3785.2%
[
3.0%
-
3.5%
]
3.14%
52,4318.7%
[
3.0%
-
3.5%
]
3.15%
4,6605.0%
[
3.5%
-
4.0%
]
3.53%
26,4725.6%
[
3.5%
-
4.0%
]
3.73%
17,1642.1%
[
3.5%
-
4.0%
]
3.82%
46,8588.7%
[
4.0%
-
4.5%
]
4.04%
5,5916.0%
[
4.0%
-
4.5%
]
4.18%
19,6043.1%
[
4.0%
-
4.5%
]
4.34%
7,6906.0%
[
4.5%
-
5.0%
]
4.52%
13,0924.4%
[
4.5%
-
5.0%
]
4.73%
63,8997.9%
[
4.5%
-
5.0%
]
4.88%
51,9156.6%
[
4.5%
-
5.0%
]
4.96%
26,8210.12%
[
5.0%
-
5.5%
]
5.28%
6,8025.8%
[
5.5%
-
6.0%
]
5.59%
44,7182.6%
[
5.5%
-
6.0%
]
5.88%
55,3361.3%
[
6.0%
-
6.5%
]
6.16%
25,0846.4%
[
6.5%
-
7.0%
]
6.64%
32,9693.1%
[
7.5%
-
8.0%
]
7.67%
5,3058.8%
[
7.5%
-
8.0%
]
7.90%
16,2862.2%
[
8.0%
-
8.5%
]
8.15%
12,5993.4%
[
8.0%
-
8.5%
]
8.34%
5,0748.3%
[
8.5%
-
9.0%
]
8.60%
24,7052.3%
[
8.5%
-
9.0%
]
8.98%
2,6056.8%
[
9.0%
-
9.5%
]
9.02%
31,9031.3%
[
9.5%
-
10.0%
]
9.75%
100,6203.9%
[
9.5%
-
10.0%
]
9.94%
75,6582.7%
[
11.0%
-
11.5%
]
11.25%
3,4681.7%
[
11.5%
-
12.0%
]
11.86%
47,6772.5%
[
12.5%
-
13.0%
]
12.76%
46,6233.4%
[
13.0%
-
13.5%
]
13.43%
3,0244.5%
[
13.5%
-
14.0%
]
13.77%
1,4609.0%
[
16.5%
-
17.0%
]
16.51%
35,4885.2%
[
17.0%
-
17.5%
]
17.34%
104,7134.5%
[
17.5%
-
18.0%
]
17.76%
69,2254.2%
[
21.5%
-
22.0%
]
21.87%
1,8204.3%
[
30.0%
-
30.5%
]
30.02%
1,3266.3%