Immigrants from Spain 4 or more Vehicles in Household
COMPARE
Immigrants from Spain
Select to Compare
4 or more Vehicles in Household
Immigrants from Spain 4 or more Vehicles in Household
5.4%
4+ VEHICLES AVAILABLE
0.3/ 100
METRIC RATING
282nd/ 347
METRIC RANK
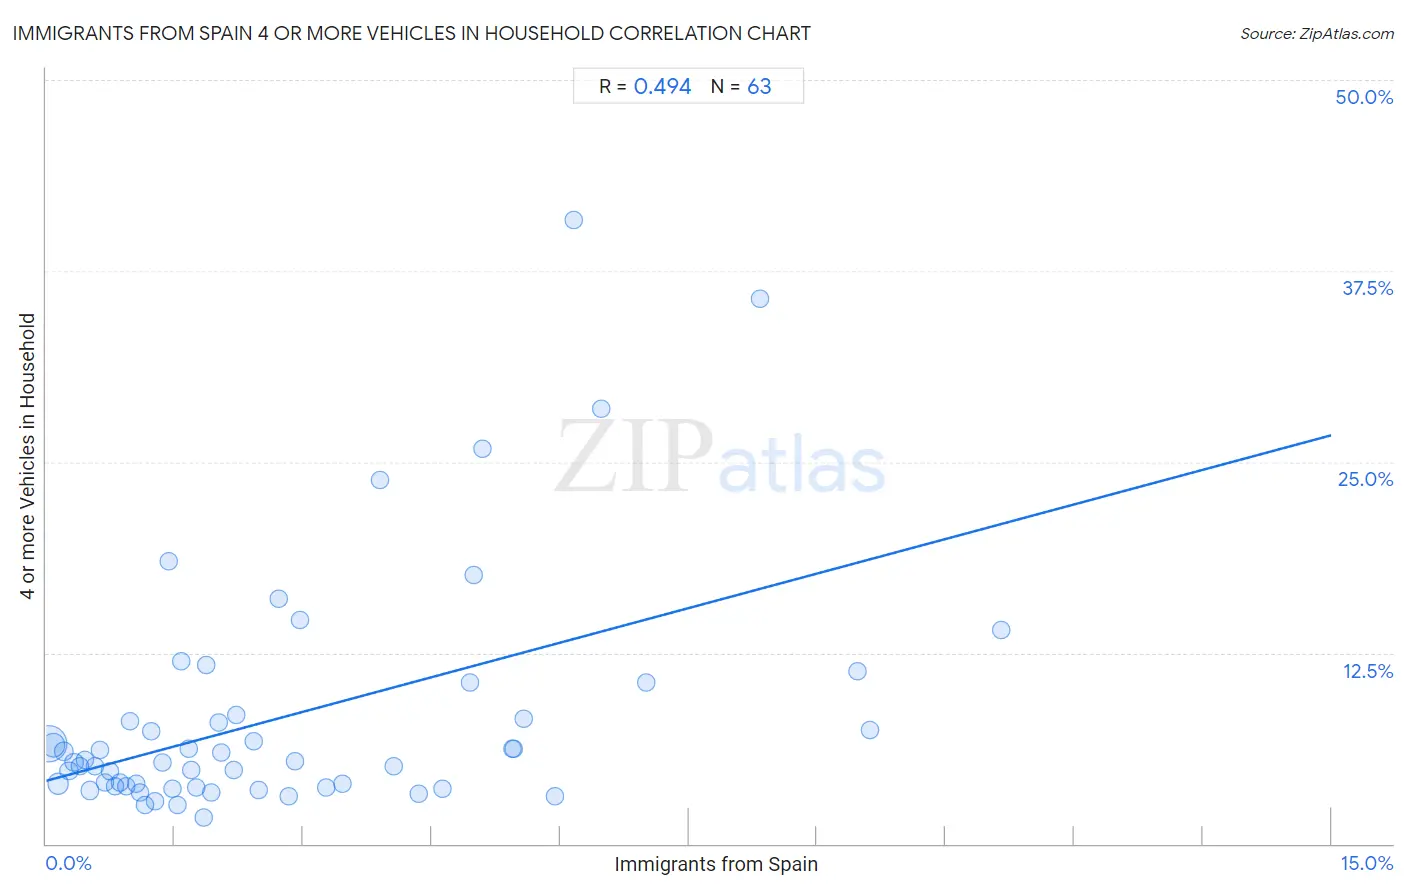
Immigrants from Spain 4 or more Vehicles in Household Correlation Chart
The statistical analysis conducted on geographies consisting of 238,415,926 people shows a moderate positive correlation between the proportion of Immigrants from Spain and percentage of households with 4 or more vehicles available in the United States with a correlation coefficient (R) of 0.494 and weighted average of 5.4%. On average, for every 1% (one percent) increase in Immigrants from Spain within a typical geography, there is an increase of 1.5% in percentage of households with 4 or more vehicles available.
It is essential to understand that the correlation between the percentage of Immigrants from Spain and percentage of households with 4 or more vehicles available does not imply a direct cause-and-effect relationship. It remains uncertain whether the presence of Immigrants from Spain influences an upward or downward trend in the level of percentage of households with 4 or more vehicles available within an area, or if Immigrants from Spain simply ended up residing in those areas with higher or lower levels of percentage of households with 4 or more vehicles available due to other factors.
Demographics Similar to Immigrants from Spain by 4 or more Vehicles in Household
In terms of 4 or more vehicles in household, the demographic groups most similar to Immigrants from Spain are Immigrants from Ireland (5.4%, a difference of 0.080%), Immigrants from Western Africa (5.4%, a difference of 0.17%), Alsatian (5.4%, a difference of 0.24%), Immigrants from Uruguay (5.4%, a difference of 0.25%), and Brazilian (5.4%, a difference of 0.37%).
| Demographics | Rating | Rank | 4 or more Vehicles in Household |
| Cambodians | 0.5 /100 | #275 | Tragic 5.5% |
| Immigrants from Latvia | 0.5 /100 | #276 | Tragic 5.5% |
| Immigrants from Bulgaria | 0.5 /100 | #277 | Tragic 5.5% |
| Immigrants from Eastern Europe | 0.4 /100 | #278 | Tragic 5.4% |
| Immigrants from Uruguay | 0.3 /100 | #279 | Tragic 5.4% |
| Alsatians | 0.3 /100 | #280 | Tragic 5.4% |
| Immigrants from Western Africa | 0.3 /100 | #281 | Tragic 5.4% |
| Immigrants from Spain | 0.3 /100 | #282 | Tragic 5.4% |
| Immigrants from Ireland | 0.3 /100 | #283 | Tragic 5.4% |
| Brazilians | 0.3 /100 | #284 | Tragic 5.4% |
| Immigrants from Liberia | 0.2 /100 | #285 | Tragic 5.4% |
| Immigrants from Colombia | 0.2 /100 | #286 | Tragic 5.4% |
| Immigrants from Croatia | 0.2 /100 | #287 | Tragic 5.4% |
| Venezuelans | 0.2 /100 | #288 | Tragic 5.3% |
| Immigrants from Bosnia and Herzegovina | 0.2 /100 | #289 | Tragic 5.3% |
Immigrants from Spain 4 or more Vehicles in Household Correlation Summary
| Measurement | Immigrants from Spain Data | 4 or more Vehicles in Household Data |
| Minimum | 0.029% | 1.7% |
| Maximum | 11.1% | 40.8% |
| Range | 11.1% | 39.1% |
| Mean | 2.8% | 8.4% |
| Median | 1.9% | 5.4% |
| Interquartile 25% (IQ1) | 0.93% | 3.7% |
| Interquartile 75% (IQ3) | 4.3% | 8.4% |
| Interquartile Range (IQR) | 3.4% | 4.7% |
| Standard Deviation (Sample) | 2.6% | 7.8% |
| Standard Deviation (Population) | 2.6% | 7.8% |
Correlation Details
| Immigrants from Spain Percentile | Sample Size | 4 or more Vehicles in Household |
[ 0.0% - 0.5% ] 0.029% | 140,037,565 | 6.6% |
[ 0.0% - 0.5% ] 0.085% | 43,751,035 | 6.5% |
[ 0.0% - 0.5% ] 0.14% | 27,612,590 | 3.9% |
[ 0.0% - 0.5% ] 0.21% | 8,493,601 | 6.0% |
[ 0.0% - 0.5% ] 0.26% | 5,864,790 | 4.8% |
[ 0.0% - 0.5% ] 0.33% | 3,550,665 | 5.3% |
[ 0.0% - 0.5% ] 0.39% | 2,020,377 | 5.1% |
[ 0.0% - 0.5% ] 0.45% | 1,381,402 | 5.5% |
[ 0.5% - 1.0% ] 0.51% | 1,822,852 | 3.5% |
[ 0.5% - 1.0% ] 0.57% | 842,611 | 5.0% |
[ 0.5% - 1.0% ] 0.63% | 677,302 | 6.2% |
[ 0.5% - 1.0% ] 0.69% | 326,512 | 4.0% |
[ 0.5% - 1.0% ] 0.74% | 185,471 | 4.8% |
[ 0.5% - 1.0% ] 0.81% | 291,564 | 3.8% |
[ 0.5% - 1.0% ] 0.86% | 210,366 | 4.0% |
[ 0.5% - 1.0% ] 0.93% | 168,402 | 3.7% |
[ 0.5% - 1.0% ] 0.98% | 160,565 | 8.0% |
[ 1.0% - 1.5% ] 1.05% | 158,839 | 4.0% |
[ 1.0% - 1.5% ] 1.10% | 159,848 | 3.3% |
[ 1.0% - 1.5% ] 1.16% | 81,660 | 2.6% |
[ 1.0% - 1.5% ] 1.23% | 57,949 | 7.4% |
[ 1.0% - 1.5% ] 1.27% | 39,392 | 2.8% |
[ 1.0% - 1.5% ] 1.35% | 99,638 | 5.3% |
[ 1.0% - 1.5% ] 1.44% | 627 | 18.5% |
[ 1.0% - 1.5% ] 1.48% | 43,199 | 3.6% |
[ 1.5% - 2.0% ] 1.53% | 25,385 | 2.5% |
[ 1.5% - 2.0% ] 1.58% | 6,512 | 12.0% |
[ 1.5% - 2.0% ] 1.66% | 3,133 | 6.2% |
[ 1.5% - 2.0% ] 1.69% | 7,493 | 4.8% |
[ 1.5% - 2.0% ] 1.74% | 10,092 | 3.7% |
[ 1.5% - 2.0% ] 1.84% | 60,116 | 1.7% |
[ 1.5% - 2.0% ] 1.87% | 9,495 | 11.7% |
[ 1.5% - 2.0% ] 1.92% | 468 | 3.4% |
[ 2.0% - 2.5% ] 2.01% | 53,976 | 7.9% |
[ 2.0% - 2.5% ] 2.04% | 5,881 | 6.0% |
[ 2.0% - 2.5% ] 2.20% | 90,089 | 4.8% |
[ 2.0% - 2.5% ] 2.22% | 270 | 8.4% |
[ 2.0% - 2.5% ] 2.42% | 2,069 | 6.7% |
[ 2.0% - 2.5% ] 2.48% | 1,575 | 3.5% |
[ 2.5% - 3.0% ] 2.72% | 7,795 | 16.0% |
[ 2.5% - 3.0% ] 2.83% | 14,441 | 3.1% |
[ 2.5% - 3.0% ] 2.90% | 19,922 | 5.4% |
[ 2.5% - 3.0% ] 2.96% | 2,801 | 14.6% |
[ 3.0% - 3.5% ] 3.27% | 3,698 | 3.7% |
[ 3.0% - 3.5% ] 3.45% | 1,014 | 3.9% |
[ 3.5% - 4.0% ] 3.89% | 565 | 23.8% |
[ 4.0% - 4.5% ] 4.05% | 5,500 | 5.1% |
[ 4.0% - 4.5% ] 4.34% | 4,098 | 3.3% |
[ 4.5% - 5.0% ] 4.63% | 2,227 | 3.6% |
[ 4.5% - 5.0% ] 4.95% | 1,333 | 10.6% |
[ 4.5% - 5.0% ] 4.99% | 1,123 | 17.6% |
[ 5.0% - 5.5% ] 5.10% | 824 | 25.9% |
[ 5.0% - 5.5% ] 5.44% | 14,639 | 6.2% |
[ 5.0% - 5.5% ] 5.46% | 14,572 | 6.2% |
[ 5.5% - 6.0% ] 5.57% | 2,368 | 8.2% |
[ 5.5% - 6.0% ] 5.94% | 707 | 3.1% |
[ 6.0% - 6.5% ] 6.16% | 146 | 40.8% |
[ 6.0% - 6.5% ] 6.48% | 633 | 28.5% |
[ 7.0% - 7.5% ] 7.00% | 714 | 10.5% |
[ 8.0% - 8.5% ] 8.33% | 84 | 35.7% |
[ 9.0% - 9.5% ] 9.47% | 697 | 11.3% |
[ 9.5% - 10.0% ] 9.61% | 281 | 7.4% |
[ 11.0% - 11.5% ] 11.14% | 368 | 14.0% |