Ugandan 4 or more Vehicles in Household

COMPARE

Ugandan
Race
Ancestry
AfghanAfricanAlaska NativeAlaskan AthabascanAlbanianAleutAlsatianAmericanApacheArabArapahoArgentineanArmenianAssyrian/Chaldean/SyriacAustralianAustrianBahamianBangladeshiBarbadianBasqueBelgianBelizeanBermudanBhutaneseBlackfeetBolivianBrazilianBritishBritish West IndianBulgarianBurmeseCajunCambodianCanadianCape VerdeanCarpatho RusynCelticCentral AmericanCentral American IndianCherokeeCheyenneChickasawChileanChineseChippewaChoctawColombianColvilleComancheCosta RicanCreeCreekCroatianCrowCubanCypriotCzechCzechoslovakianDanishDelawareDominicanDutchDutch West IndianEastern EuropeanEcuadorianEgyptianEnglishEstonianEthiopianEuropeanFijianFilipinoFinnishFrenchFrench American IndianFrench CanadianGermanGerman RussianGhanaianGreekGuamanian/ChamorroGuatemalanGuyaneseHaitianHmongHonduranHopiHoumaHungarianIcelanderIndian (Asian)IndonesianInupiatIranianIraqiIrishIroquoisIsraeliItalianJamaicanJapaneseJordanianKenyanKiowaKoreanLaotianLatvianLebaneseLiberianLithuanianLumbeeLuxembourgerMacedonianMalaysianMalteseMarshalleseMenomineeMexicanMexican American IndianMongolianMoroccanNative HawaiianNavajoNepaleseNew ZealanderNicaraguanNigerianNorthern EuropeanNorwegianOkinawanOsageOttawaPaiutePakistaniPalestinianPanamanianParaguayanPennsylvania GermanPeruvianPimaPolishPortuguesePotawatomiPuebloPuerto RicanPuget Sound SalishRomanianRussianSalvadoranSamoanScandinavianScotch-IrishScottishSeminoleSenegaleseSerbianShoshoneSierra LeoneanSiouxSlavicSlovakSloveneSomaliSouth AfricanSouth AmericanSouth American IndianSoviet UnionSpaniardSpanishSpanish AmericanSpanish American IndianSri LankanSubsaharan AfricanSudaneseSwedishSwissSyrianTaiwaneseThaiTlingit-HaidaTohono O'OdhamTonganTrinidadian and TobagonianTsimshianTurkishU.S. Virgin IslanderUgandanUkrainianUruguayanUteVenezuelanVietnameseWelshWest IndianYakamaYaquiYugoslavianYumanYup'ikZimbabwean
Immigration
NonimmigrantsImmigrantsAfghanistanAfricaAlbaniaArgentinaArmeniaAsiaAustraliaAustriaBahamasBangladeshBarbadosBelarusBelgiumBelizeBoliviaBosnia and HerzegovinaBrazilBulgariaBurma/MyanmarCabo VerdeCambodiaCameroonCanadaCaribbeanCentral AmericaChileChinaColombiaCongoCosta RicaCroatiaCubaCzechoslovakiaDenmarkDominicaDominican RepublicEastern AfricaEastern AsiaEastern EuropeEcuadorEgyptEl SalvadorEnglandEritreaEthiopiaEuropeFijiFranceGermanyGhanaGreeceGrenadaGuatemalaGuyanaHaitiHondurasHong KongHungaryIndiaIndonesiaIranIraqIrelandIsraelItalyJamaicaJapanJordanKazakhstanKenyaKoreaKuwaitLaosLatin AmericaLatviaLebanonLiberiaLithuaniaMalaysiaMexicoMicronesiaMiddle AfricaMoldovaMoroccoNepalNetherlandsNicaraguaNigeriaNorth AmericaNorth MacedoniaNorthern AfricaNorthern EuropeNorwayOceaniaPakistanPanamaPeruPhilippinesPolandPortugalRomaniaRussiaSaudi ArabiaScotlandSenegalSerbiaSierra LeoneSingaporeSomaliaSouth AfricaSouth AmericaSouth Central AsiaSouth Eastern AsiaSouthern EuropeSpainSri LankaSt. Vincent and the GrenadinesSudanSwedenSwitzerlandSyriaTaiwanThailandTrinidad and TobagoTurkeyUgandaUkraineUruguayUzbekistanVenezuelaVietnamWest IndiesWestern AfricaWestern AsiaWestern EuropeYemenZaireZimbabweAzores
Select to Compare
Race
Ancestry
AfghanAfricanAlaska NativeAlaskan AthabascanAlbanianAleutAlsatianAmericanApacheArabArapahoArgentineanArmenianAssyrian/Chaldean/SyriacAustralianAustrianBahamianBangladeshiBarbadianBasqueBelgianBelizeanBermudanBhutaneseBlackfeetBolivianBrazilianBritishBritish West IndianBulgarianBurmeseCajunCambodianCanadianCape VerdeanCarpatho RusynCelticCentral AmericanCentral American IndianCherokeeCheyenneChickasawChileanChineseChippewaChoctawColombianColvilleComancheCosta RicanCreeCreekCroatianCrowCubanCypriotCzechCzechoslovakianDanishDelawareDominicanDutchDutch West IndianEastern EuropeanEcuadorianEgyptianEnglishEstonianEthiopianEuropeanFijianFilipinoFinnishFrenchFrench American IndianFrench CanadianGermanGerman RussianGhanaianGreekGuamanian/ChamorroGuatemalanGuyaneseHaitianHmongHonduranHopiHoumaHungarianIcelanderIndian (Asian)IndonesianInupiatIranianIraqiIrishIroquoisIsraeliItalianJamaicanJapaneseJordanianKenyanKiowaKoreanLaotianLatvianLebaneseLiberianLithuanianLumbeeLuxembourgerMacedonianMalaysianMalteseMarshalleseMenomineeMexicanMexican American IndianMongolianMoroccanNative HawaiianNavajoNepaleseNew ZealanderNicaraguanNigerianNorthern EuropeanNorwegianOkinawanOsageOttawaPaiutePakistaniPalestinianPanamanianParaguayanPennsylvania GermanPeruvianPimaPolishPortuguesePotawatomiPuebloPuerto RicanPuget Sound SalishRomanianRussianSalvadoranSamoanScandinavianScotch-IrishScottishSeminoleSenegaleseSerbianShoshoneSierra LeoneanSiouxSlavicSlovakSloveneSomaliSouth AfricanSouth AmericanSouth American IndianSoviet UnionSpaniardSpanishSpanish AmericanSpanish American IndianSri LankanSubsaharan AfricanSudaneseSwedishSwissSyrianTaiwaneseThaiTlingit-HaidaTohono O'OdhamTonganTrinidadian and TobagonianTsimshianTurkishU.S. Virgin IslanderUkrainianUruguayanUteVenezuelanVietnameseWelshWest IndianYakamaYaquiYugoslavianYumanYup'ikZimbabwean
Immigration
NonimmigrantsImmigrantsAfghanistanAfricaAlbaniaArgentinaArmeniaAsiaAustraliaAustriaBahamasBangladeshBarbadosBelarusBelgiumBelizeBoliviaBosnia and HerzegovinaBrazilBulgariaBurma/MyanmarCabo VerdeCambodiaCameroonCanadaCaribbeanCentral AmericaChileChinaColombiaCongoCosta RicaCroatiaCubaCzechoslovakiaDenmarkDominicaDominican RepublicEastern AfricaEastern AsiaEastern EuropeEcuadorEgyptEl SalvadorEnglandEritreaEthiopiaEuropeFijiFranceGermanyGhanaGreeceGrenadaGuatemalaGuyanaHaitiHondurasHong KongHungaryIndiaIndonesiaIranIraqIrelandIsraelItalyJamaicaJapanJordanKazakhstanKenyaKoreaKuwaitLaosLatin AmericaLatviaLebanonLiberiaLithuaniaMalaysiaMexicoMicronesiaMiddle AfricaMoldovaMoroccoNepalNetherlandsNicaraguaNigeriaNorth AmericaNorth MacedoniaNorthern AfricaNorthern EuropeNorwayOceaniaPakistanPanamaPeruPhilippinesPolandPortugalRomaniaRussiaSaudi ArabiaScotlandSenegalSerbiaSierra LeoneSingaporeSomaliaSouth AfricaSouth AmericaSouth Central AsiaSouth Eastern AsiaSouthern EuropeSpainSri LankaSt. Vincent and the GrenadinesSudanSwedenSwitzerlandSyriaTaiwanThailandTrinidad and TobagoTurkeyUgandaUkraineUruguayUzbekistanVenezuelaVietnamWest IndiesWestern AfricaWestern AsiaWestern EuropeYemenZaireZimbabweAzores
4 or more Vehicles in Household
Income
Poverty
Unemployment
Labor Participation
Family Structure
Vehicle Availability
Education Level
Disability

Ugandan 4 or more Vehicles in Household
Tragic

5.7%
4+ VEHICLES AVAILABLE
2.2/ 100
METRIC RATING
251st/ 347
METRIC RANK

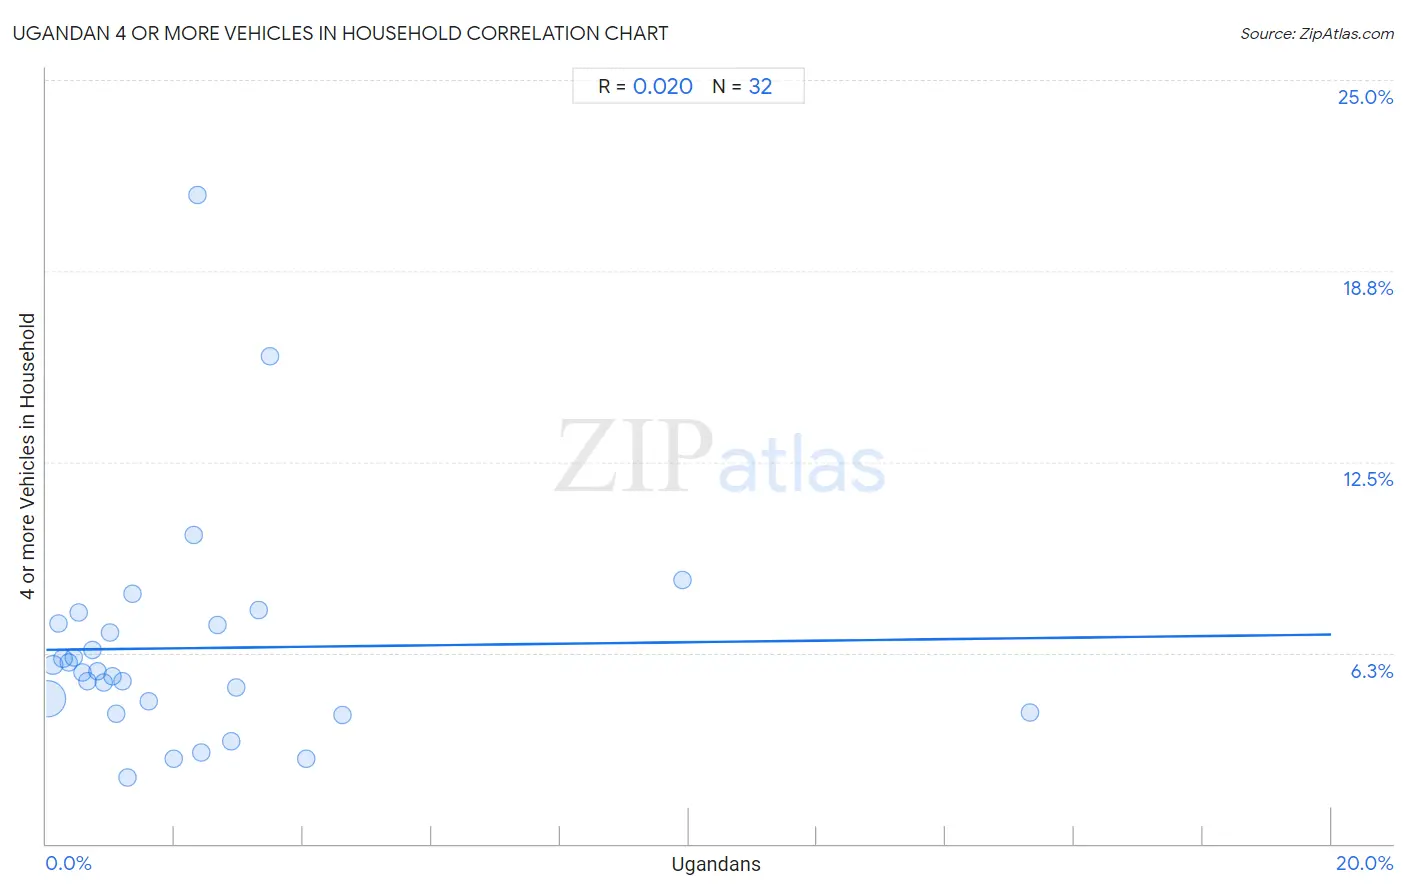
Ugandan 4 or more Vehicles in Household Correlation Chart

The statistical analysis conducted on geographies consisting of 93,911,160 people shows no correlation between the proportion of Ugandans and percentage of households with 4 or more vehicles available in the United States with a correlation coefficient (R) of 0.020 and weighted average of 5.7%. On average, for every 1% (one percent) increase in Ugandans within a typical geography, there is an increase of 0.025% in percentage of households with 4 or more vehicles available.
Ugandan 4 or more Vehicles in Household
It is essential to understand that the correlation between the percentage of Ugandans and percentage of households with 4 or more vehicles available does not imply a direct cause-and-effect relationship. It remains uncertain whether the presence of Ugandans influences an upward or downward trend in the level of percentage of households with 4 or more vehicles available within an area, or if Ugandans simply ended up residing in those areas with higher or lower levels of percentage of households with 4 or more vehicles available due to other factors.

Demographics Similar to Ugandans by 4 or more Vehicles in Household

In terms of 4 or more vehicles in household, the demographic groups most similar to Ugandans are Immigrants from Europe (5.7%, a difference of 0.020%), Immigrants from Southern Europe (5.7%, a difference of 0.12%), Immigrants from Eastern Africa (5.7%, a difference of 0.14%), Subsaharan African (5.7%, a difference of 0.23%), and Immigrants from Ethiopia (5.7%, a difference of 0.25%).
DemographicsRating | Rank4 or more Vehicles in Household
Ethiopians
3.2
/100
|
#244
Tragic
5.8%
Bulgarians
3.1
/100
|
#245
Tragic
5.8%
Immigrants from North Macedonia
2.5
/100
|
#246
Tragic
5.7%
Immigrants from Ethiopia
2.4
/100
|
#247
Tragic
5.7%
Immigrants from Eastern Africa
2.4
/100
|
#248
Tragic
5.7%
Immigrants from Southern Europe
2.3
/100
|
#249
Tragic
5.7%
Immigrants from Europe
2.3
/100
|
#250
Tragic
5.7%
Ugandans
2.2
/100
|
#251
Tragic
5.7%
Sub-Saharan Africans
2.1
/100
|
#252
Tragic
5.7%
Immigrants from Cuba
1.6
/100
|
#253
Tragic
5.7%
Immigrants from Panama
1.5
/100
|
#254
Tragic
5.7%
Yup'ik
1.5
/100
|
#255
Tragic
5.7%
Immigrants from Turkey
1.5
/100
|
#256
Tragic
5.7%
Immigrants from Northern Africa
1.4
/100
|
#257
Tragic
5.6%
Immigrants from Lithuania
1.4
/100
|
#258
Tragic
5.6%

Ugandan 4 or more Vehicles in Household Correlation Summary

MeasurementUgandan Data4 or more Vehicles in Household Data
Minimum0.016%2.2%
Maximum15.3%21.2%
Range15.3%19.1%
Mean2.3%6.4%
Median1.2%5.6%
Interquartile 25% (IQ1)0.61%4.5%
Interquartile 75% (IQ3)2.8%7.2%
Interquartile Range (IQR)2.2%2.7%
Standard Deviation (Sample)3.1%3.7%
Standard Deviation (Population)3.0%3.7%

Correlation Details

Ugandan PercentileSample Size4 or more Vehicles in Household
[
0.0%
-
0.5%
]
0.016%
81,497,5234.8%
[
0.0%
-
0.5%
]
0.10%
6,235,6455.8%
[
0.0%
-
0.5%
]
0.19%
2,313,2617.2%
[
0.0%
-
0.5%
]
0.26%
1,396,0166.1%
[
0.0%
-
0.5%
]
0.35%
573,5845.9%
[
0.0%
-
0.5%
]
0.44%
505,7246.1%
[
0.0%
-
0.5%
]
0.50%
258,1467.6%
[
0.5%
-
1.0%
]
0.57%
194,8705.6%
[
0.5%
-
1.0%
]
0.64%
253,5195.3%
[
0.5%
-
1.0%
]
0.72%
100,9116.3%
[
0.5%
-
1.0%
]
0.79%
110,9005.7%
[
0.5%
-
1.0%
]
0.90%
39,9415.3%
[
0.5%
-
1.0%
]
0.98%
27,5196.9%
[
1.0%
-
1.5%
]
1.03%
18,1705.5%
[
1.0%
-
1.5%
]
1.09%
157,6474.3%
[
1.0%
-
1.5%
]
1.19%
44,2085.3%
[
1.0%
-
1.5%
]
1.26%
13,5162.2%
[
1.0%
-
1.5%
]
1.34%
49,0748.2%
[
1.5%
-
2.0%
]
1.60%
5,6824.7%
[
1.5%
-
2.0%
]
1.99%
6042.8%
[
2.0%
-
2.5%
]
2.29%
1,04910.1%
[
2.0%
-
2.5%
]
2.36%
14,20221.2%
[
2.0%
-
2.5%
]
2.42%
9,0193.0%
[
2.5%
-
3.0%
]
2.67%
1,0107.2%
[
2.5%
-
3.0%
]
2.87%
16,1453.4%
[
2.5%
-
3.0%
]
2.96%
34,5365.1%
[
3.0%
-
3.5%
]
3.30%
6,4267.6%
[
3.0%
-
3.5%
]
3.47%
2,27415.9%
[
4.0%
-
4.5%
]
4.05%
1,2102.8%
[
4.5%
-
5.0%
]
4.61%
26,6844.2%
[
9.5%
-
10.0%
]
9.90%
1,3038.6%
[
15.0%
-
15.5%
]
15.32%
8424.3%