Immigrants from Israel 4 or more Vehicles in Household
COMPARE
Immigrants from Israel
Select to Compare
4 or more Vehicles in Household
Immigrants from Israel 4 or more Vehicles in Household
4.8%
4+ VEHICLES AVAILABLE
0.0/ 100
METRIC RATING
313th/ 347
METRIC RANK
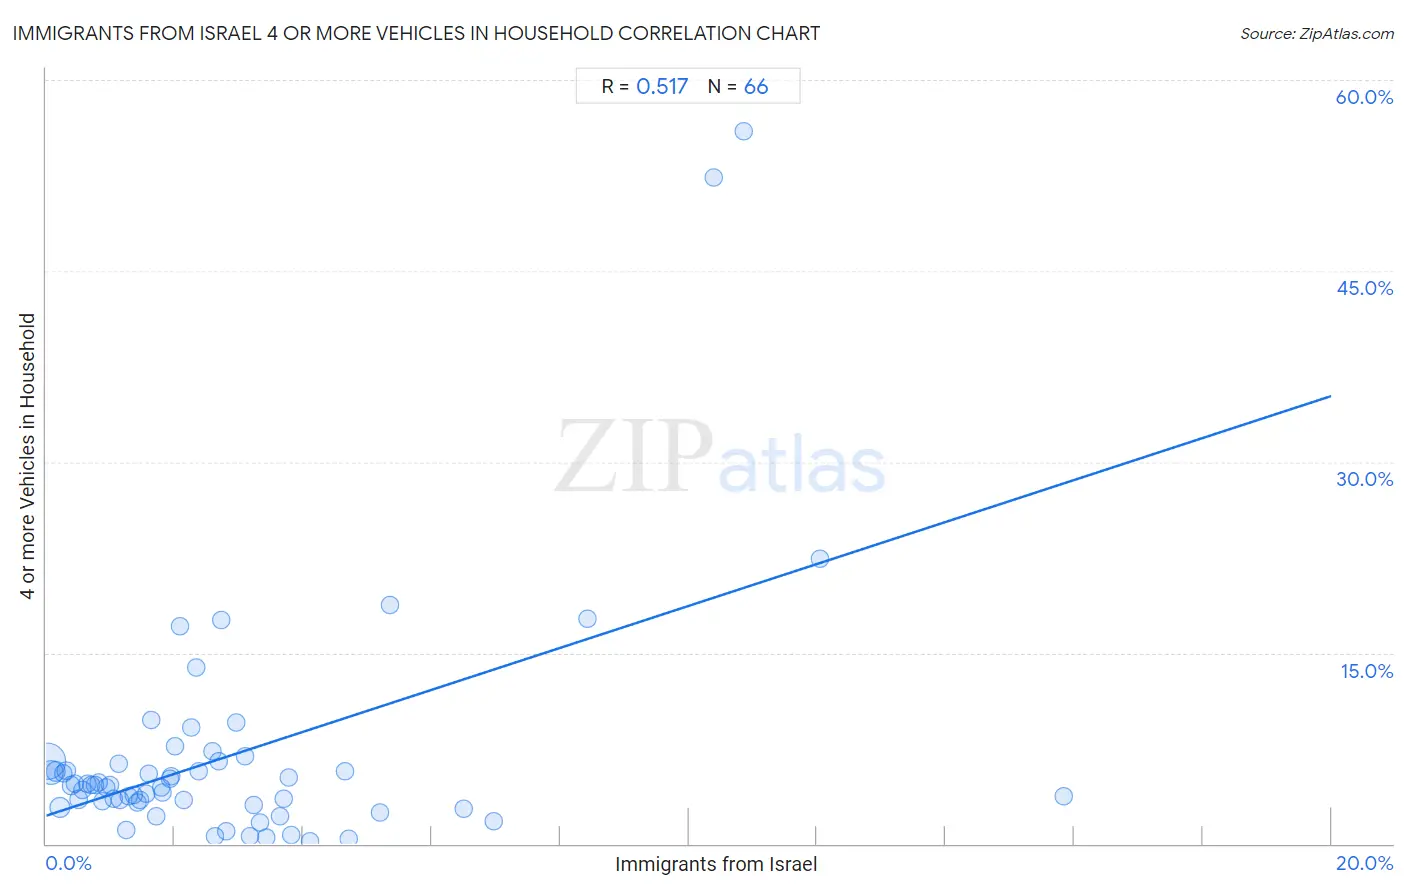
Immigrants from Israel 4 or more Vehicles in Household Correlation Chart
The statistical analysis conducted on geographies consisting of 208,870,296 people shows a substantial positive correlation between the proportion of Immigrants from Israel and percentage of households with 4 or more vehicles available in the United States with a correlation coefficient (R) of 0.517 and weighted average of 4.8%. On average, for every 1% (one percent) increase in Immigrants from Israel within a typical geography, there is an increase of 1.6% in percentage of households with 4 or more vehicles available.
It is essential to understand that the correlation between the percentage of Immigrants from Israel and percentage of households with 4 or more vehicles available does not imply a direct cause-and-effect relationship. It remains uncertain whether the presence of Immigrants from Israel influences an upward or downward trend in the level of percentage of households with 4 or more vehicles available within an area, or if Immigrants from Israel simply ended up residing in those areas with higher or lower levels of percentage of households with 4 or more vehicles available due to other factors.
Demographics Similar to Immigrants from Israel by 4 or more Vehicles in Household
In terms of 4 or more vehicles in household, the demographic groups most similar to Immigrants from Israel are Albanian (4.8%, a difference of 0.010%), Immigrants from West Indies (4.7%, a difference of 0.79%), Immigrants from Belarus (4.7%, a difference of 0.88%), Puerto Rican (4.7%, a difference of 1.3%), and Houma (4.9%, a difference of 2.7%).
| Demographics | Rating | Rank | 4 or more Vehicles in Household |
| Immigrants from Serbia | 0.0 /100 | #306 | Tragic 5.0% |
| Menominee | 0.0 /100 | #307 | Tragic 5.0% |
| Paraguayans | 0.0 /100 | #308 | Tragic 4.9% |
| Immigrants from Somalia | 0.0 /100 | #309 | Tragic 4.9% |
| Moroccans | 0.0 /100 | #310 | Tragic 4.9% |
| Houma | 0.0 /100 | #311 | Tragic 4.9% |
| Albanians | 0.0 /100 | #312 | Tragic 4.8% |
| Immigrants from Israel | 0.0 /100 | #313 | Tragic 4.8% |
| Immigrants from West Indies | 0.0 /100 | #314 | Tragic 4.7% |
| Immigrants from Belarus | 0.0 /100 | #315 | Tragic 4.7% |
| Puerto Ricans | 0.0 /100 | #316 | Tragic 4.7% |
| U.S. Virgin Islanders | 0.0 /100 | #317 | Tragic 4.6% |
| Jamaicans | 0.0 /100 | #318 | Tragic 4.6% |
| Haitians | 0.0 /100 | #319 | Tragic 4.6% |
| Immigrants from Haiti | 0.0 /100 | #320 | Tragic 4.5% |
Immigrants from Israel 4 or more Vehicles in Household Correlation Summary
| Measurement | Immigrants from Israel Data | 4 or more Vehicles in Household Data |
| Minimum | 0.027% | 0.22% |
| Maximum | 15.8% | 55.9% |
| Range | 15.8% | 55.7% |
| Mean | 2.9% | 6.9% |
| Median | 2.0% | 4.6% |
| Interquartile 25% (IQ1) | 1.00% | 3.3% |
| Interquartile 75% (IQ3) | 3.4% | 6.3% |
| Interquartile Range (IQR) | 2.4% | 3.0% |
| Standard Deviation (Sample) | 3.0% | 9.6% |
| Standard Deviation (Population) | 3.0% | 9.5% |
Correlation Details
| Immigrants from Israel Percentile | Sample Size | 4 or more Vehicles in Household |
[ 0.0% - 0.5% ] 0.027% | 115,473,338 | 6.5% |
[ 0.0% - 0.5% ] 0.087% | 38,080,503 | 5.6% |
[ 0.0% - 0.5% ] 0.15% | 13,569,344 | 5.7% |
[ 0.0% - 0.5% ] 0.22% | 16,261,750 | 2.8% |
[ 0.0% - 0.5% ] 0.27% | 6,018,228 | 5.5% |
[ 0.0% - 0.5% ] 0.32% | 7,149,082 | 5.7% |
[ 0.0% - 0.5% ] 0.39% | 2,208,673 | 4.6% |
[ 0.0% - 0.5% ] 0.45% | 1,526,417 | 4.7% |
[ 0.5% - 1.0% ] 0.51% | 1,309,062 | 3.5% |
[ 0.5% - 1.0% ] 0.57% | 799,531 | 4.2% |
[ 0.5% - 1.0% ] 0.63% | 956,880 | 4.7% |
[ 0.5% - 1.0% ] 0.70% | 596,583 | 4.6% |
[ 0.5% - 1.0% ] 0.76% | 645,270 | 4.6% |
[ 0.5% - 1.0% ] 0.81% | 467,278 | 4.8% |
[ 0.5% - 1.0% ] 0.87% | 629,337 | 3.3% |
[ 0.5% - 1.0% ] 0.94% | 640,576 | 4.4% |
[ 0.5% - 1.0% ] 1.00% | 212,078 | 4.6% |
[ 1.0% - 1.5% ] 1.06% | 258,632 | 3.6% |
[ 1.0% - 1.5% ] 1.12% | 336,155 | 6.3% |
[ 1.0% - 1.5% ] 1.15% | 184,583 | 3.4% |
[ 1.0% - 1.5% ] 1.24% | 112,624 | 1.0% |
[ 1.0% - 1.5% ] 1.28% | 149,842 | 3.7% |
[ 1.0% - 1.5% ] 1.36% | 87,263 | 3.8% |
[ 1.0% - 1.5% ] 1.41% | 100,014 | 3.3% |
[ 1.0% - 1.5% ] 1.47% | 40,861 | 3.5% |
[ 1.5% - 2.0% ] 1.55% | 87,458 | 3.9% |
[ 1.5% - 2.0% ] 1.59% | 113,181 | 5.5% |
[ 1.5% - 2.0% ] 1.63% | 1,350 | 9.7% |
[ 1.5% - 2.0% ] 1.71% | 49,604 | 2.1% |
[ 1.5% - 2.0% ] 1.78% | 115,232 | 4.4% |
[ 1.5% - 2.0% ] 1.81% | 81,463 | 4.0% |
[ 1.5% - 2.0% ] 1.92% | 1,822 | 5.1% |
[ 1.5% - 2.0% ] 1.95% | 59,070 | 5.3% |
[ 2.0% - 2.5% ] 2.01% | 1,445 | 7.6% |
[ 2.0% - 2.5% ] 2.08% | 6,244 | 17.1% |
[ 2.0% - 2.5% ] 2.14% | 57,847 | 3.5% |
[ 2.0% - 2.5% ] 2.27% | 50,132 | 9.1% |
[ 2.0% - 2.5% ] 2.33% | 5,958 | 13.8% |
[ 2.0% - 2.5% ] 2.37% | 20,180 | 5.7% |
[ 2.5% - 3.0% ] 2.58% | 16,190 | 7.2% |
[ 2.5% - 3.0% ] 2.62% | 62,698 | 0.63% |
[ 2.5% - 3.0% ] 2.69% | 74,332 | 6.5% |
[ 2.5% - 3.0% ] 2.73% | 1,136 | 17.6% |
[ 2.5% - 3.0% ] 2.81% | 39,621 | 1.0% |
[ 2.5% - 3.0% ] 2.96% | 4,428 | 9.5% |
[ 3.0% - 3.5% ] 3.09% | 6,764 | 6.9% |
[ 3.0% - 3.5% ] 3.17% | 41,621 | 0.57% |
[ 3.0% - 3.5% ] 3.23% | 31,910 | 3.0% |
[ 3.0% - 3.5% ] 3.33% | 32,881 | 1.7% |
[ 3.0% - 3.5% ] 3.43% | 962 | 0.45% |
[ 3.5% - 4.0% ] 3.65% | 1,207 | 2.1% |
[ 3.5% - 4.0% ] 3.70% | 54 | 3.6% |
[ 3.5% - 4.0% ] 3.77% | 106 | 5.2% |
[ 3.5% - 4.0% ] 3.82% | 2,750 | 0.67% |
[ 4.0% - 4.5% ] 4.10% | 20,411 | 0.22% |
[ 4.5% - 5.0% ] 4.66% | 1,438 | 5.7% |
[ 4.5% - 5.0% ] 4.70% | 31,517 | 0.43% |
[ 5.0% - 5.5% ] 5.20% | 3,440 | 2.4% |
[ 5.0% - 5.5% ] 5.35% | 1,066 | 18.7% |
[ 6.0% - 6.5% ] 6.49% | 18,210 | 2.8% |
[ 6.5% - 7.0% ] 6.96% | 9,860 | 1.8% |
[ 8.0% - 8.5% ] 8.42% | 1,366 | 17.7% |
[ 10.0% - 10.5% ] 10.39% | 308 | 52.4% |
[ 10.5% - 11.0% ] 10.85% | 295 | 55.9% |
[ 12.0% - 12.5% ] 12.03% | 349 | 22.4% |
[ 15.5% - 16.0% ] 15.84% | 486 | 3.7% |