Cajun 4 or more Vehicles in Household
COMPARE
Cajun
Select to Compare
4 or more Vehicles in Household
Cajun 4 or more Vehicles in Household
6.0%
4+ VEHICLES AVAILABLE
9.2/ 100
METRIC RATING
222nd/ 347
METRIC RANK
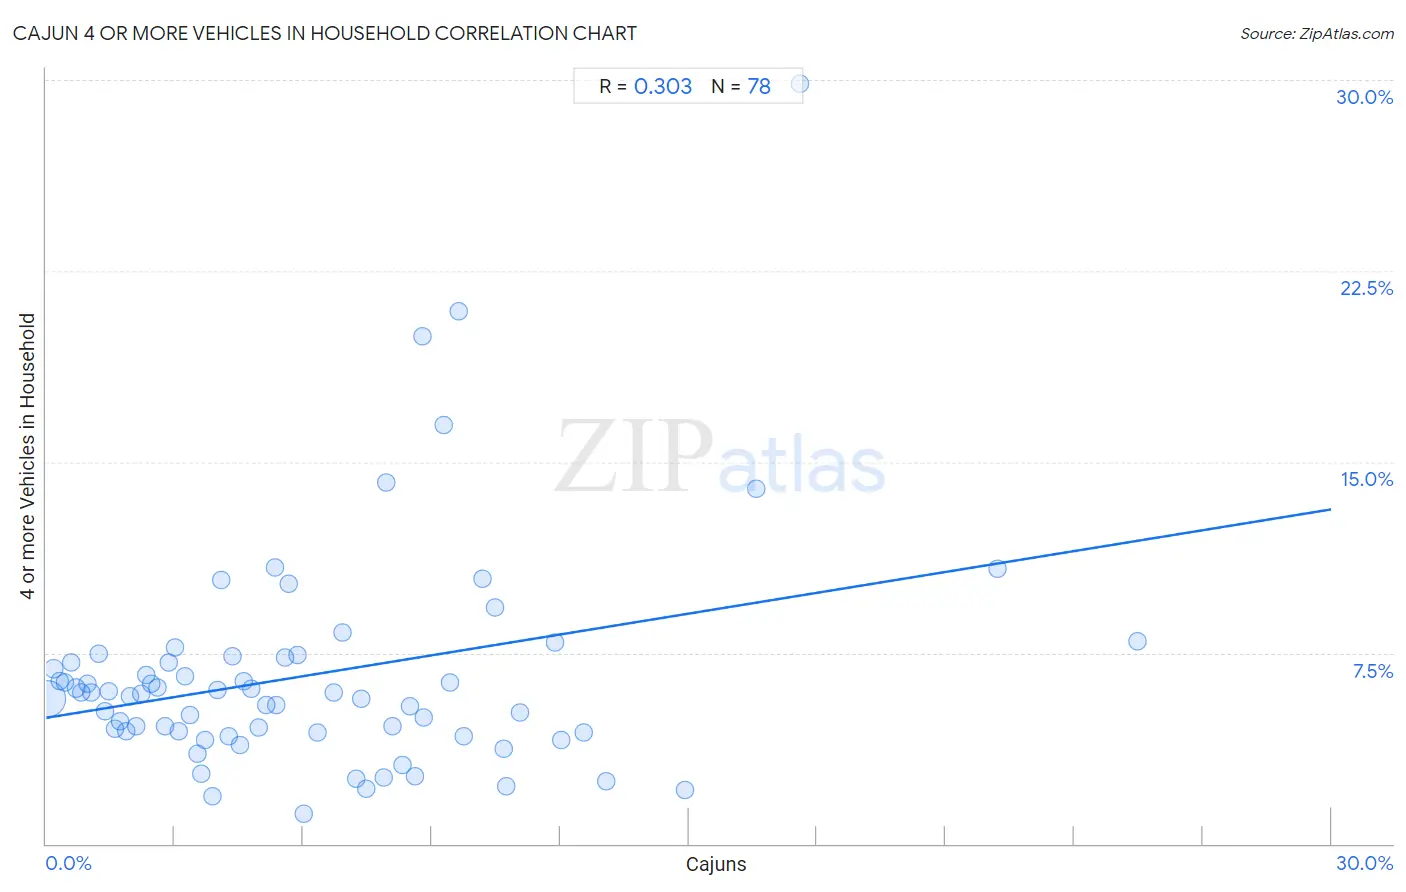
Cajun 4 or more Vehicles in Household Correlation Chart
The statistical analysis conducted on geographies consisting of 149,483,009 people shows a mild positive correlation between the proportion of Cajuns and percentage of households with 4 or more vehicles available in the United States with a correlation coefficient (R) of 0.303 and weighted average of 6.0%. On average, for every 1% (one percent) increase in Cajuns within a typical geography, there is an increase of 0.27% in percentage of households with 4 or more vehicles available.
It is essential to understand that the correlation between the percentage of Cajuns and percentage of households with 4 or more vehicles available does not imply a direct cause-and-effect relationship. It remains uncertain whether the presence of Cajuns influences an upward or downward trend in the level of percentage of households with 4 or more vehicles available within an area, or if Cajuns simply ended up residing in those areas with higher or lower levels of percentage of households with 4 or more vehicles available due to other factors.
Demographics Similar to Cajuns by 4 or more Vehicles in Household
In terms of 4 or more vehicles in household, the demographic groups most similar to Cajuns are Immigrants from Kenya (6.0%, a difference of 0.0%), Cuban (6.0%, a difference of 0.010%), Immigrants from Moldova (6.0%, a difference of 0.030%), Indonesian (6.0%, a difference of 0.090%), and Russian (6.0%, a difference of 0.33%).
| Demographics | Rating | Rank | 4 or more Vehicles in Household |
| Immigrants from China | 13.8 /100 | #215 | Poor 6.0% |
| Immigrants from Romania | 13.8 /100 | #216 | Poor 6.0% |
| Nigerians | 12.2 /100 | #217 | Poor 6.0% |
| Immigrants from Italy | 11.0 /100 | #218 | Poor 6.0% |
| Serbians | 11.0 /100 | #219 | Poor 6.0% |
| Russians | 10.3 /100 | #220 | Poor 6.0% |
| Immigrants from Moldova | 9.3 /100 | #221 | Tragic 6.0% |
| Cajuns | 9.2 /100 | #222 | Tragic 6.0% |
| Immigrants from Kenya | 9.2 /100 | #223 | Tragic 6.0% |
| Cubans | 9.2 /100 | #224 | Tragic 6.0% |
| Indonesians | 8.9 /100 | #225 | Tragic 6.0% |
| Immigrants from Singapore | 7.9 /100 | #226 | Tragic 5.9% |
| Immigrants from Western Asia | 7.8 /100 | #227 | Tragic 5.9% |
| Immigrants from Uganda | 7.5 /100 | #228 | Tragic 5.9% |
| Eastern Europeans | 6.8 /100 | #229 | Tragic 5.9% |
Cajun 4 or more Vehicles in Household Correlation Summary
| Measurement | Cajun Data | 4 or more Vehicles in Household Data |
| Minimum | 0.029% | 1.2% |
| Maximum | 25.5% | 29.9% |
| Range | 25.4% | 28.7% |
| Mean | 6.2% | 6.6% |
| Median | 5.0% | 5.9% |
| Interquartile 25% (IQ1) | 2.5% | 4.4% |
| Interquartile 75% (IQ3) | 8.8% | 7.3% |
| Interquartile Range (IQR) | 6.3% | 2.9% |
| Standard Deviation (Sample) | 5.0% | 4.5% |
| Standard Deviation (Population) | 4.9% | 4.4% |
Correlation Details
| Cajun Percentile | Sample Size | 4 or more Vehicles in Household |
[ 0.0% - 0.5% ] 0.029% | 130,613,392 | 5.7% |
[ 0.0% - 0.5% ] 0.18% | 9,175,429 | 6.9% |
[ 0.0% - 0.5% ] 0.31% | 3,456,897 | 6.4% |
[ 0.0% - 0.5% ] 0.44% | 1,249,510 | 6.3% |
[ 0.5% - 1.0% ] 0.57% | 860,353 | 7.1% |
[ 0.5% - 1.0% ] 0.69% | 686,310 | 6.1% |
[ 0.5% - 1.0% ] 0.81% | 509,497 | 5.9% |
[ 0.5% - 1.0% ] 0.96% | 388,772 | 6.3% |
[ 1.0% - 1.5% ] 1.06% | 348,376 | 6.0% |
[ 1.0% - 1.5% ] 1.21% | 154,849 | 7.4% |
[ 1.0% - 1.5% ] 1.36% | 139,404 | 5.2% |
[ 1.0% - 1.5% ] 1.47% | 174,374 | 6.0% |
[ 1.5% - 2.0% ] 1.61% | 127,070 | 4.5% |
[ 1.5% - 2.0% ] 1.71% | 102,631 | 4.8% |
[ 1.5% - 2.0% ] 1.86% | 154,216 | 4.4% |
[ 1.5% - 2.0% ] 1.96% | 176,850 | 5.8% |
[ 2.0% - 2.5% ] 2.09% | 129,896 | 4.6% |
[ 2.0% - 2.5% ] 2.23% | 43,800 | 5.9% |
[ 2.0% - 2.5% ] 2.33% | 70,844 | 6.6% |
[ 2.0% - 2.5% ] 2.46% | 79,335 | 6.3% |
[ 2.5% - 3.0% ] 2.61% | 114,184 | 6.1% |
[ 2.5% - 3.0% ] 2.78% | 53,056 | 4.6% |
[ 2.5% - 3.0% ] 2.86% | 8,422 | 7.1% |
[ 3.0% - 3.5% ] 3.01% | 39,547 | 7.7% |
[ 3.0% - 3.5% ] 3.09% | 100,522 | 4.4% |
[ 3.0% - 3.5% ] 3.23% | 120,835 | 6.6% |
[ 3.0% - 3.5% ] 3.37% | 60,216 | 5.0% |
[ 3.5% - 4.0% ] 3.53% | 538 | 3.5% |
[ 3.5% - 4.0% ] 3.62% | 4,172 | 2.8% |
[ 3.5% - 4.0% ] 3.71% | 18,577 | 4.1% |
[ 3.5% - 4.0% ] 3.89% | 3,417 | 1.8% |
[ 4.0% - 4.5% ] 4.01% | 31,642 | 6.0% |
[ 4.0% - 4.5% ] 4.10% | 122 | 10.3% |
[ 4.0% - 4.5% ] 4.25% | 6,498 | 4.2% |
[ 4.0% - 4.5% ] 4.36% | 734 | 7.4% |
[ 4.5% - 5.0% ] 4.51% | 26,231 | 3.9% |
[ 4.5% - 5.0% ] 4.61% | 3,794 | 6.4% |
[ 4.5% - 5.0% ] 4.79% | 9,850 | 6.1% |
[ 4.5% - 5.0% ] 4.96% | 6,507 | 4.6% |
[ 5.0% - 5.5% ] 5.13% | 19,497 | 5.4% |
[ 5.0% - 5.5% ] 5.34% | 8,745 | 10.8% |
[ 5.0% - 5.5% ] 5.38% | 2,474 | 5.4% |
[ 5.5% - 6.0% ] 5.56% | 5,108 | 7.3% |
[ 5.5% - 6.0% ] 5.66% | 7,045 | 10.2% |
[ 5.5% - 6.0% ] 5.88% | 6,466 | 7.4% |
[ 6.0% - 6.5% ] 6.02% | 7,223 | 1.2% |
[ 6.0% - 6.5% ] 6.33% | 7,809 | 4.4% |
[ 6.5% - 7.0% ] 6.72% | 16,937 | 5.9% |
[ 6.5% - 7.0% ] 6.90% | 9,823 | 8.3% |
[ 7.0% - 7.5% ] 7.22% | 11,726 | 2.5% |
[ 7.0% - 7.5% ] 7.34% | 30,530 | 5.7% |
[ 7.0% - 7.5% ] 7.47% | 5,579 | 2.2% |
[ 7.5% - 8.0% ] 7.88% | 2,437 | 2.6% |
[ 7.5% - 8.0% ] 7.95% | 1,069 | 14.2% |
[ 8.0% - 8.5% ] 8.09% | 5,528 | 4.6% |
[ 8.0% - 8.5% ] 8.32% | 2,633 | 3.1% |
[ 8.5% - 9.0% ] 8.50% | 13,329 | 5.4% |
[ 8.5% - 9.0% ] 8.60% | 1,546 | 2.6% |
[ 8.5% - 9.0% ] 8.78% | 1,766 | 19.9% |
[ 8.5% - 9.0% ] 8.81% | 885 | 5.0% |
[ 9.0% - 9.5% ] 9.29% | 915 | 16.5% |
[ 9.0% - 9.5% ] 9.43% | 23,891 | 6.3% |
[ 9.5% - 10.0% ] 9.64% | 1,473 | 20.9% |
[ 9.5% - 10.0% ] 9.76% | 1,445 | 4.2% |
[ 10.0% - 10.5% ] 10.18% | 855 | 10.4% |
[ 10.0% - 10.5% ] 10.47% | 1,518 | 9.3% |
[ 10.5% - 11.0% ] 10.69% | 8,271 | 3.8% |
[ 10.5% - 11.0% ] 10.73% | 177 | 2.3% |
[ 11.0% - 11.5% ] 11.06% | 5,423 | 5.2% |
[ 11.5% - 12.0% ] 11.87% | 691 | 7.9% |
[ 12.0% - 12.5% ] 12.01% | 2,215 | 4.1% |
[ 12.5% - 13.0% ] 12.55% | 1,147 | 4.4% |
[ 13.0% - 13.5% ] 13.06% | 9,326 | 2.4% |
[ 14.5% - 15.0% ] 14.92% | 1,220 | 2.1% |
[ 16.5% - 17.0% ] 16.57% | 3,754 | 13.9% |
[ 17.5% - 18.0% ] 17.59% | 216 | 29.9% |
[ 22.0% - 22.5% ] 22.22% | 207 | 10.8% |
[ 25.0% - 25.5% ] 25.47% | 1,441 | 7.9% |