Samoan 4 or more Vehicles in Household
COMPARE
Samoan
Select to Compare
4 or more Vehicles in Household
Samoan 4 or more Vehicles in Household
9.2%
4+ VEHICLES AVAILABLE
100.0/ 100
METRIC RATING
9th/ 347
METRIC RANK
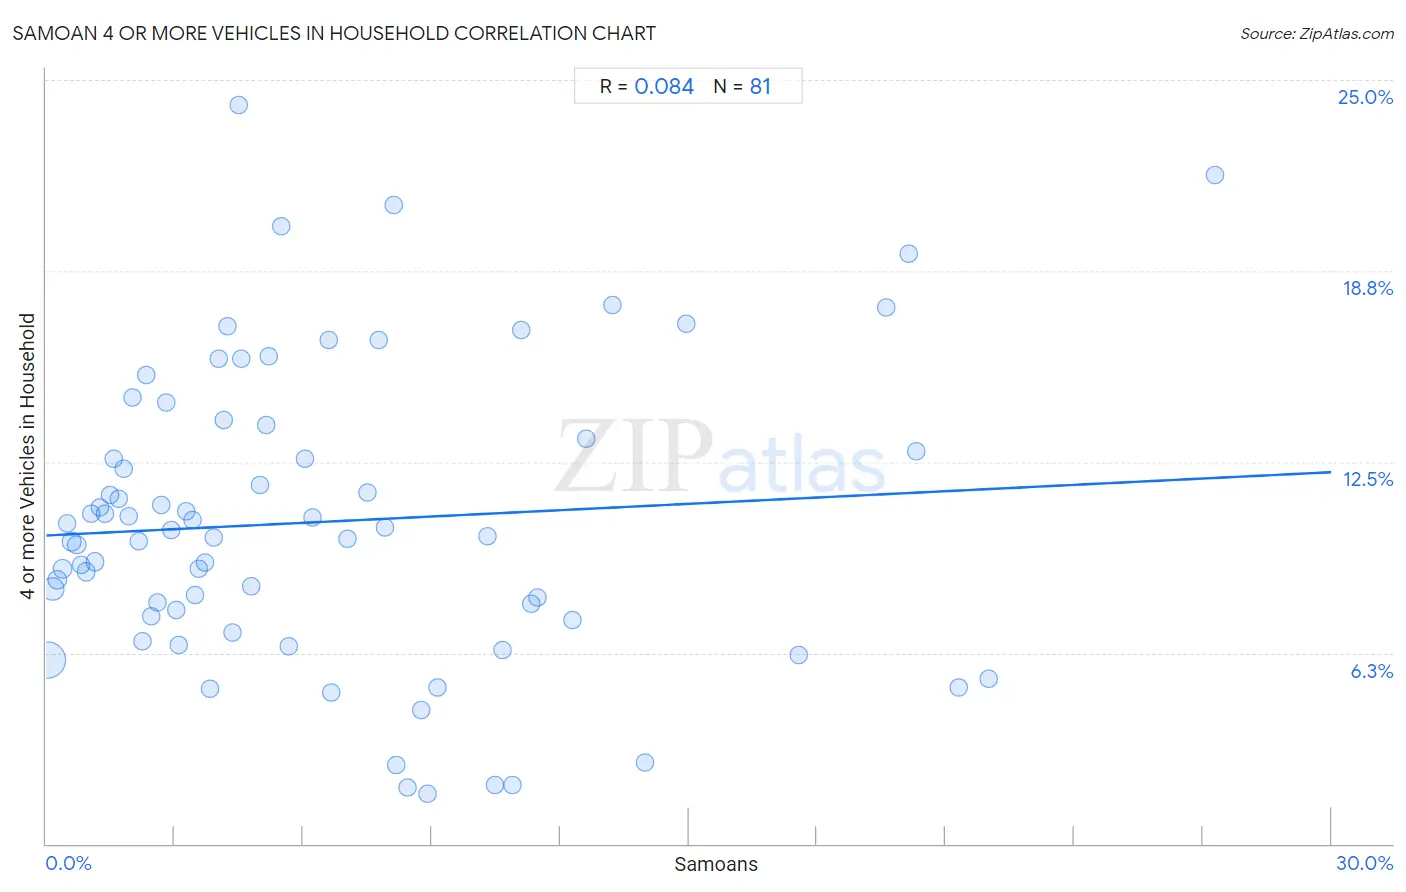
Samoan 4 or more Vehicles in Household Correlation Chart
The statistical analysis conducted on geographies consisting of 224,510,493 people shows a slight positive correlation between the proportion of Samoans and percentage of households with 4 or more vehicles available in the United States with a correlation coefficient (R) of 0.084 and weighted average of 9.2%. On average, for every 1% (one percent) increase in Samoans within a typical geography, there is an increase of 0.069% in percentage of households with 4 or more vehicles available.
It is essential to understand that the correlation between the percentage of Samoans and percentage of households with 4 or more vehicles available does not imply a direct cause-and-effect relationship. It remains uncertain whether the presence of Samoans influences an upward or downward trend in the level of percentage of households with 4 or more vehicles available within an area, or if Samoans simply ended up residing in those areas with higher or lower levels of percentage of households with 4 or more vehicles available due to other factors.
Demographics Similar to Samoans by 4 or more Vehicles in Household
In terms of 4 or more vehicles in household, the demographic groups most similar to Samoans are Arapaho (9.4%, a difference of 1.4%), Native Hawaiian (9.4%, a difference of 1.8%), Puget Sound Salish (9.4%, a difference of 1.8%), Paiute (9.0%, a difference of 2.4%), and Immigrants from Mexico (9.0%, a difference of 2.5%).
| Demographics | Rating | Rank | 4 or more Vehicles in Household |
| Colville | 100.0 /100 | #2 | Exceptional 11.1% |
| Spanish American Indians | 100.0 /100 | #3 | Exceptional 10.8% |
| Tongans | 100.0 /100 | #4 | Exceptional 10.0% |
| Immigrants from Fiji | 100.0 /100 | #5 | Exceptional 9.6% |
| Puget Sound Salish | 100.0 /100 | #6 | Exceptional 9.4% |
| Native Hawaiians | 100.0 /100 | #7 | Exceptional 9.4% |
| Arapaho | 100.0 /100 | #8 | Exceptional 9.4% |
| Samoans | 100.0 /100 | #9 | Exceptional 9.2% |
| Paiute | 100.0 /100 | #10 | Exceptional 9.0% |
| Immigrants from Mexico | 100.0 /100 | #11 | Exceptional 9.0% |
| Mexicans | 100.0 /100 | #12 | Exceptional 8.9% |
| Hawaiians | 100.0 /100 | #13 | Exceptional 8.9% |
| Chinese | 100.0 /100 | #14 | Exceptional 8.8% |
| Shoshone | 100.0 /100 | #15 | Exceptional 8.8% |
| Lumbee | 100.0 /100 | #16 | Exceptional 8.8% |
Samoan 4 or more Vehicles in Household Correlation Summary
| Measurement | Samoan Data | 4 or more Vehicles in Household Data |
| Minimum | 0.040% | 1.7% |
| Maximum | 27.3% | 24.2% |
| Range | 27.2% | 22.5% |
| Mean | 6.5% | 10.5% |
| Median | 4.5% | 10.1% |
| Interquartile 25% (IQ1) | 2.2% | 7.4% |
| Interquartile 75% (IQ3) | 9.0% | 13.5% |
| Interquartile Range (IQR) | 6.8% | 6.1% |
| Standard Deviation (Sample) | 5.9% | 4.9% |
| Standard Deviation (Population) | 5.9% | 4.8% |
Correlation Details
| Samoan Percentile | Sample Size | 4 or more Vehicles in Household |
[ 0.0% - 0.5% ] 0.040% | 145,068,049 | 6.0% |
[ 0.0% - 0.5% ] 0.15% | 35,561,387 | 8.3% |
[ 0.0% - 0.5% ] 0.26% | 12,876,887 | 8.6% |
[ 0.0% - 0.5% ] 0.38% | 8,681,283 | 9.0% |
[ 0.0% - 0.5% ] 0.49% | 5,630,892 | 10.5% |
[ 0.5% - 1.0% ] 0.60% | 3,149,420 | 9.9% |
[ 0.5% - 1.0% ] 0.71% | 2,382,401 | 9.8% |
[ 0.5% - 1.0% ] 0.81% | 2,038,923 | 9.1% |
[ 0.5% - 1.0% ] 0.94% | 1,416,715 | 8.9% |
[ 1.0% - 1.5% ] 1.05% | 1,085,160 | 10.8% |
[ 1.0% - 1.5% ] 1.14% | 851,707 | 9.2% |
[ 1.0% - 1.5% ] 1.27% | 671,890 | 11.0% |
[ 1.0% - 1.5% ] 1.38% | 696,866 | 10.8% |
[ 1.0% - 1.5% ] 1.49% | 268,228 | 11.4% |
[ 1.5% - 2.0% ] 1.58% | 437,074 | 12.6% |
[ 1.5% - 2.0% ] 1.71% | 390,439 | 11.3% |
[ 1.5% - 2.0% ] 1.81% | 307,863 | 12.3% |
[ 1.5% - 2.0% ] 1.93% | 257,599 | 10.7% |
[ 2.0% - 2.5% ] 2.01% | 159,999 | 14.6% |
[ 2.0% - 2.5% ] 2.16% | 204,349 | 9.9% |
[ 2.0% - 2.5% ] 2.26% | 446,400 | 6.6% |
[ 2.0% - 2.5% ] 2.35% | 44,337 | 15.4% |
[ 2.0% - 2.5% ] 2.46% | 78,279 | 7.4% |
[ 2.5% - 3.0% ] 2.61% | 373,158 | 7.9% |
[ 2.5% - 3.0% ] 2.69% | 172,433 | 11.1% |
[ 2.5% - 3.0% ] 2.80% | 25,082 | 14.5% |
[ 2.5% - 3.0% ] 2.91% | 60,518 | 10.3% |
[ 3.0% - 3.5% ] 3.02% | 68,537 | 7.7% |
[ 3.0% - 3.5% ] 3.11% | 56,437 | 6.5% |
[ 3.0% - 3.5% ] 3.26% | 103,784 | 10.9% |
[ 3.0% - 3.5% ] 3.40% | 39,480 | 10.6% |
[ 3.0% - 3.5% ] 3.47% | 119,589 | 8.1% |
[ 3.5% - 4.0% ] 3.56% | 61,891 | 9.0% |
[ 3.5% - 4.0% ] 3.70% | 51,223 | 9.2% |
[ 3.5% - 4.0% ] 3.82% | 41,455 | 5.1% |
[ 3.5% - 4.0% ] 3.90% | 14,251 | 10.0% |
[ 4.0% - 4.5% ] 4.02% | 27,517 | 15.9% |
[ 4.0% - 4.5% ] 4.13% | 74,292 | 13.9% |
[ 4.0% - 4.5% ] 4.23% | 42,360 | 16.9% |
[ 4.0% - 4.5% ] 4.36% | 17,867 | 6.9% |
[ 4.0% - 4.5% ] 4.49% | 5,905 | 24.2% |
[ 4.5% - 5.0% ] 4.55% | 13,705 | 15.9% |
[ 4.5% - 5.0% ] 4.78% | 3,741 | 8.4% |
[ 4.5% - 5.0% ] 4.99% | 28,173 | 11.7% |
[ 5.0% - 5.5% ] 5.12% | 36,489 | 13.7% |
[ 5.0% - 5.5% ] 5.21% | 57,907 | 15.9% |
[ 5.0% - 5.5% ] 5.47% | 25,427 | 20.2% |
[ 5.5% - 6.0% ] 5.67% | 7,903 | 6.5% |
[ 6.0% - 6.5% ] 6.04% | 72,324 | 12.6% |
[ 6.0% - 6.5% ] 6.21% | 11,373 | 10.7% |
[ 6.5% - 7.0% ] 6.60% | 2,122 | 16.5% |
[ 6.5% - 7.0% ] 6.65% | 7,551 | 4.9% |
[ 7.0% - 7.5% ] 7.04% | 696 | 10.0% |
[ 7.5% - 8.0% ] 7.51% | 17,628 | 11.5% |
[ 7.5% - 8.0% ] 7.76% | 2,744 | 16.5% |
[ 7.5% - 8.0% ] 7.90% | 51,367 | 10.3% |
[ 8.0% - 8.5% ] 8.11% | 3,909 | 20.9% |
[ 8.0% - 8.5% ] 8.17% | 465 | 2.6% |
[ 8.0% - 8.5% ] 8.44% | 237 | 1.8% |
[ 8.5% - 9.0% ] 8.74% | 10,042 | 4.4% |
[ 8.5% - 9.0% ] 8.91% | 3,188 | 1.7% |
[ 9.0% - 9.5% ] 9.14% | 38,142 | 5.1% |
[ 10.0% - 10.5% ] 10.30% | 4,555 | 10.1% |
[ 10.0% - 10.5% ] 10.49% | 391 | 1.9% |
[ 10.5% - 11.0% ] 10.66% | 6,606 | 6.3% |
[ 10.5% - 11.0% ] 10.88% | 377 | 1.9% |
[ 11.0% - 11.5% ] 11.09% | 649 | 16.8% |
[ 11.0% - 11.5% ] 11.33% | 256 | 7.8% |
[ 11.0% - 11.5% ] 11.46% | 759 | 8.1% |
[ 12.0% - 12.5% ] 12.30% | 244 | 7.3% |
[ 12.5% - 13.0% ] 12.61% | 3,593 | 13.3% |
[ 13.0% - 13.5% ] 13.21% | 12,370 | 17.6% |
[ 13.5% - 14.0% ] 13.99% | 143 | 2.7% |
[ 14.5% - 15.0% ] 14.96% | 341 | 17.0% |
[ 17.5% - 18.0% ] 17.56% | 5,713 | 6.2% |
[ 19.5% - 20.0% ] 19.60% | 1,949 | 17.5% |
[ 20.0% - 20.5% ] 20.14% | 1,897 | 19.3% |
[ 20.0% - 20.5% ] 20.32% | 2,274 | 12.8% |
[ 21.0% - 21.5% ] 21.30% | 5,774 | 5.1% |
[ 22.0% - 22.5% ] 22.01% | 5,411 | 5.4% |
[ 27.0% - 27.5% ] 27.27% | 132 | 21.9% |