Uruguayan 4 or more Vehicles in Household
COMPARE
Uruguayan
Select to Compare
4 or more Vehicles in Household
Uruguayan 4 or more Vehicles in Household
5.6%
4+ VEHICLES AVAILABLE
1.3/ 100
METRIC RATING
260th/ 347
METRIC RANK
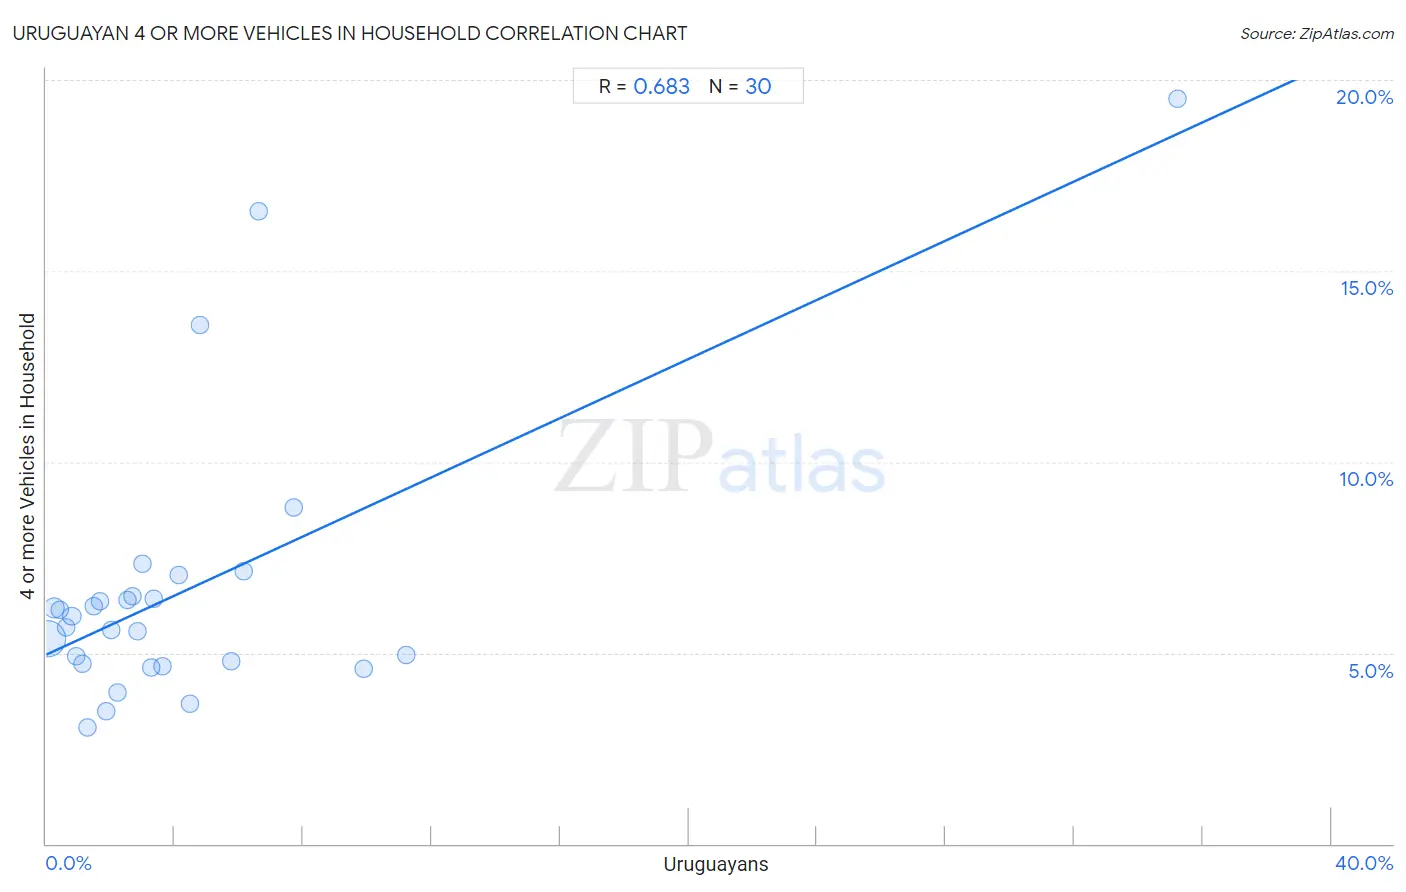
Uruguayan 4 or more Vehicles in Household Correlation Chart
The statistical analysis conducted on geographies consisting of 144,399,753 people shows a significant positive correlation between the proportion of Uruguayans and percentage of households with 4 or more vehicles available in the United States with a correlation coefficient (R) of 0.683 and weighted average of 5.6%. On average, for every 1% (one percent) increase in Uruguayans within a typical geography, there is an increase of 0.39% in percentage of households with 4 or more vehicles available.
It is essential to understand that the correlation between the percentage of Uruguayans and percentage of households with 4 or more vehicles available does not imply a direct cause-and-effect relationship. It remains uncertain whether the presence of Uruguayans influences an upward or downward trend in the level of percentage of households with 4 or more vehicles available within an area, or if Uruguayans simply ended up residing in those areas with higher or lower levels of percentage of households with 4 or more vehicles available due to other factors.
Demographics Similar to Uruguayans by 4 or more Vehicles in Household
In terms of 4 or more vehicles in household, the demographic groups most similar to Uruguayans are Sudanese (5.6%, a difference of 0.090%), Immigrants from France (5.6%, a difference of 0.18%), Bermudan (5.6%, a difference of 0.20%), Immigrants from Lithuania (5.6%, a difference of 0.22%), and Immigrants from Saudi Arabia (5.6%, a difference of 0.29%).
| Demographics | Rating | Rank | 4 or more Vehicles in Household |
| Immigrants from Cuba | 1.6 /100 | #253 | Tragic 5.7% |
| Immigrants from Panama | 1.5 /100 | #254 | Tragic 5.7% |
| Yup'ik | 1.5 /100 | #255 | Tragic 5.7% |
| Immigrants from Turkey | 1.5 /100 | #256 | Tragic 5.7% |
| Immigrants from Northern Africa | 1.4 /100 | #257 | Tragic 5.6% |
| Immigrants from Lithuania | 1.4 /100 | #258 | Tragic 5.6% |
| Immigrants from France | 1.3 /100 | #259 | Tragic 5.6% |
| Uruguayans | 1.3 /100 | #260 | Tragic 5.6% |
| Sudanese | 1.2 /100 | #261 | Tragic 5.6% |
| Bermudans | 1.2 /100 | #262 | Tragic 5.6% |
| Immigrants from Saudi Arabia | 1.1 /100 | #263 | Tragic 5.6% |
| Immigrants from Africa | 1.0 /100 | #264 | Tragic 5.6% |
| South Americans | 0.9 /100 | #265 | Tragic 5.6% |
| Immigrants from Nepal | 0.9 /100 | #266 | Tragic 5.6% |
| Immigrants from Ukraine | 0.9 /100 | #267 | Tragic 5.6% |
Uruguayan 4 or more Vehicles in Household Correlation Summary
| Measurement | Uruguayan Data | 4 or more Vehicles in Household Data |
| Minimum | 0.040% | 3.1% |
| Maximum | 35.2% | 19.5% |
| Range | 35.2% | 16.5% |
| Mean | 4.4% | 6.7% |
| Median | 2.8% | 5.8% |
| Interquartile 25% (IQ1) | 1.3% | 4.7% |
| Interquartile 75% (IQ3) | 4.8% | 6.5% |
| Interquartile Range (IQR) | 3.5% | 1.7% |
| Standard Deviation (Sample) | 6.4% | 3.7% |
| Standard Deviation (Population) | 6.3% | 3.6% |
Correlation Details
| Uruguayan Percentile | Sample Size | 4 or more Vehicles in Household |
[ 0.0% - 0.5% ] 0.040% | 125,853,020 | 5.4% |
[ 0.0% - 0.5% ] 0.25% | 11,748,300 | 6.2% |
[ 0.0% - 0.5% ] 0.42% | 2,705,515 | 6.1% |
[ 0.5% - 1.0% ] 0.61% | 1,646,023 | 5.7% |
[ 0.5% - 1.0% ] 0.80% | 870,268 | 5.9% |
[ 0.5% - 1.0% ] 0.94% | 519,332 | 4.9% |
[ 1.0% - 1.5% ] 1.13% | 223,111 | 4.7% |
[ 1.0% - 1.5% ] 1.29% | 250,862 | 3.1% |
[ 1.0% - 1.5% ] 1.48% | 234,103 | 6.2% |
[ 1.5% - 2.0% ] 1.67% | 133,798 | 6.3% |
[ 1.5% - 2.0% ] 1.85% | 71,071 | 3.5% |
[ 2.0% - 2.5% ] 2.02% | 52,551 | 5.6% |
[ 2.0% - 2.5% ] 2.23% | 61,363 | 4.0% |
[ 2.5% - 3.0% ] 2.53% | 3,158 | 6.4% |
[ 2.5% - 3.0% ] 2.69% | 1,747 | 6.5% |
[ 2.5% - 3.0% ] 2.83% | 1,659 | 5.6% |
[ 2.5% - 3.0% ] 3.00% | 1,067 | 7.3% |
[ 3.0% - 3.5% ] 3.28% | 1,250 | 4.6% |
[ 3.0% - 3.5% ] 3.36% | 506 | 6.4% |
[ 3.5% - 4.0% ] 3.61% | 887 | 4.7% |
[ 4.0% - 4.5% ] 4.11% | 7,857 | 7.0% |
[ 4.0% - 4.5% ] 4.46% | 830 | 3.7% |
[ 4.5% - 5.0% ] 4.79% | 313 | 13.6% |
[ 5.5% - 6.0% ] 5.75% | 2,367 | 4.8% |
[ 6.0% - 6.5% ] 6.15% | 179 | 7.1% |
[ 6.5% - 7.0% ] 6.63% | 4,553 | 16.6% |
[ 7.5% - 8.0% ] 7.69% | 611 | 8.8% |
[ 9.5% - 10.0% ] 9.89% | 3,114 | 4.6% |
[ 11.0% - 11.5% ] 11.20% | 250 | 5.0% |
[ 35.0% - 35.5% ] 35.23% | 88 | 19.5% |