Chickasaw 4 or more Vehicles in Household
COMPARE
Chickasaw
Select to Compare
4 or more Vehicles in Household
Chickasaw 4 or more Vehicles in Household
7.4%
4+ VEHICLES AVAILABLE
99.9/ 100
METRIC RATING
71st/ 347
METRIC RANK
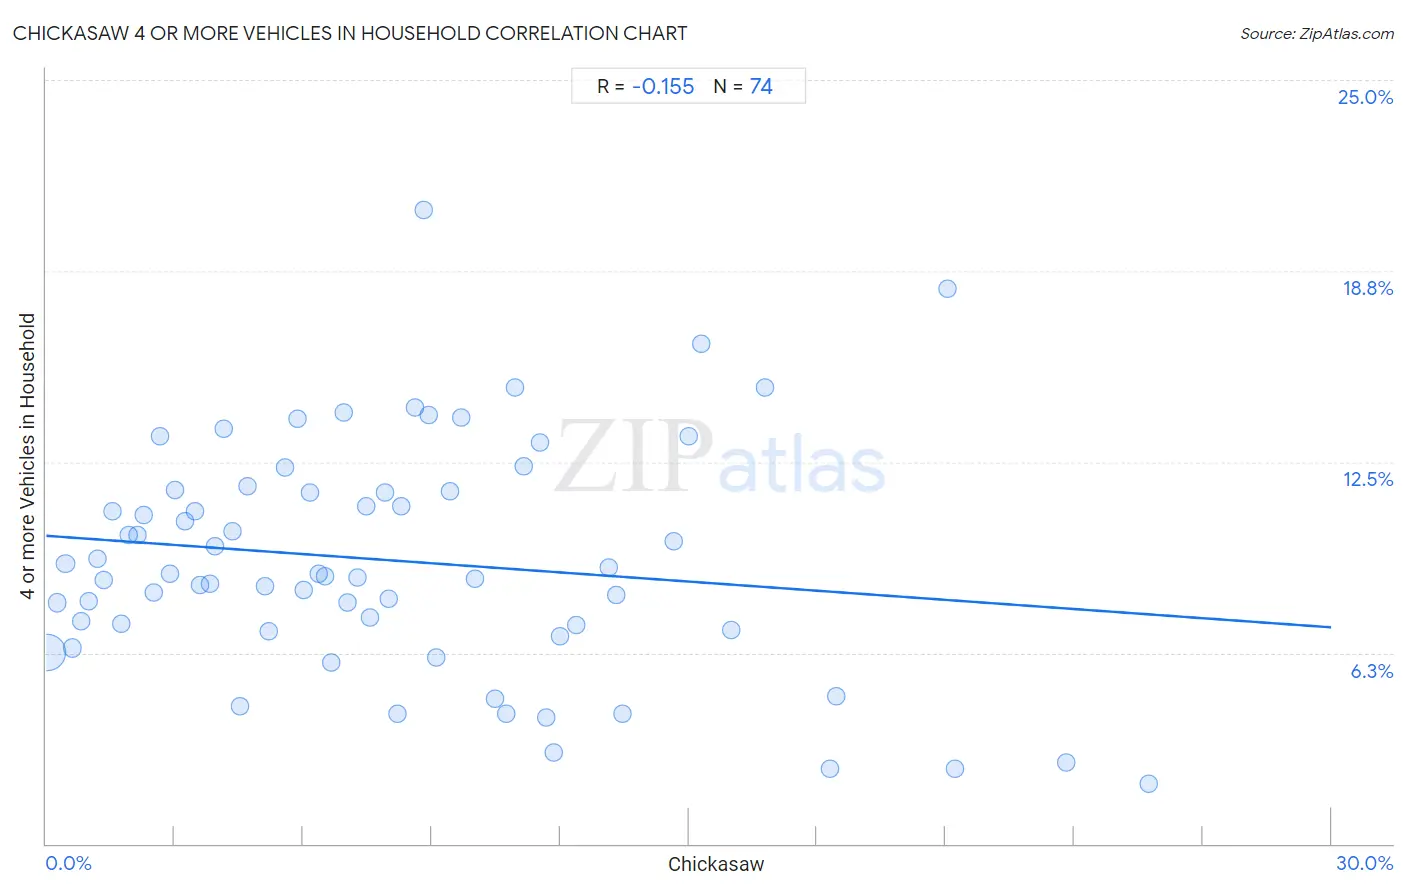
Chickasaw 4 or more Vehicles in Household Correlation Chart
The statistical analysis conducted on geographies consisting of 147,524,339 people shows a poor negative correlation between the proportion of Chickasaw and percentage of households with 4 or more vehicles available in the United States with a correlation coefficient (R) of -0.155 and weighted average of 7.4%. On average, for every 1% (one percent) increase in Chickasaw within a typical geography, there is a decrease of 0.100% in percentage of households with 4 or more vehicles available.
It is essential to understand that the correlation between the percentage of Chickasaw and percentage of households with 4 or more vehicles available does not imply a direct cause-and-effect relationship. It remains uncertain whether the presence of Chickasaw influences an upward or downward trend in the level of percentage of households with 4 or more vehicles available within an area, or if Chickasaw simply ended up residing in those areas with higher or lower levels of percentage of households with 4 or more vehicles available due to other factors.
Demographics Similar to Chickasaw by 4 or more Vehicles in Household
In terms of 4 or more vehicles in household, the demographic groups most similar to Chickasaw are Scottish (7.4%, a difference of 0.13%), German (7.5%, a difference of 0.20%), Scotch-Irish (7.4%, a difference of 0.30%), Portuguese (7.4%, a difference of 0.39%), and Icelander (7.4%, a difference of 0.69%).
| Demographics | Rating | Rank | 4 or more Vehicles in Household |
| Bangladeshis | 100.0 /100 | #64 | Exceptional 7.6% |
| Immigrants from the Azores | 100.0 /100 | #65 | Exceptional 7.5% |
| Immigrants from Taiwan | 99.9 /100 | #66 | Exceptional 7.5% |
| Americans | 99.9 /100 | #67 | Exceptional 7.5% |
| Welsh | 99.9 /100 | #68 | Exceptional 7.5% |
| Germans | 99.9 /100 | #69 | Exceptional 7.5% |
| Scottish | 99.9 /100 | #70 | Exceptional 7.4% |
| Chickasaw | 99.9 /100 | #71 | Exceptional 7.4% |
| Scotch-Irish | 99.9 /100 | #72 | Exceptional 7.4% |
| Portuguese | 99.9 /100 | #73 | Exceptional 7.4% |
| Icelanders | 99.9 /100 | #74 | Exceptional 7.4% |
| Immigrants from Cambodia | 99.9 /100 | #75 | Exceptional 7.4% |
| Laotians | 99.9 /100 | #76 | Exceptional 7.4% |
| Apache | 99.9 /100 | #77 | Exceptional 7.4% |
| Whites/Caucasians | 99.8 /100 | #78 | Exceptional 7.4% |
Chickasaw 4 or more Vehicles in Household Correlation Summary
| Measurement | Chickasaw Data | 4 or more Vehicles in Household Data |
| Minimum | 0.032% | 2.0% |
| Maximum | 25.7% | 20.8% |
| Range | 25.7% | 18.8% |
| Mean | 8.1% | 9.3% |
| Median | 7.2% | 8.8% |
| Interquartile 25% (IQ1) | 3.5% | 7.0% |
| Interquartile 75% (IQ3) | 11.5% | 11.5% |
| Interquartile Range (IQR) | 8.1% | 4.5% |
| Standard Deviation (Sample) | 5.9% | 3.8% |
| Standard Deviation (Population) | 5.8% | 3.8% |
Correlation Details
| Chickasaw Percentile | Sample Size | 4 or more Vehicles in Household |
[ 0.0% - 0.5% ] 0.032% | 136,520,136 | 6.3% |
[ 0.0% - 0.5% ] 0.25% | 5,291,713 | 7.9% |
[ 0.0% - 0.5% ] 0.45% | 1,596,768 | 9.2% |
[ 0.5% - 1.0% ] 0.60% | 1,613,456 | 6.4% |
[ 0.5% - 1.0% ] 0.83% | 819,319 | 7.3% |
[ 0.5% - 1.0% ] 0.99% | 474,437 | 7.9% |
[ 1.0% - 1.5% ] 1.19% | 233,583 | 9.3% |
[ 1.0% - 1.5% ] 1.35% | 249,739 | 8.6% |
[ 1.5% - 2.0% ] 1.54% | 89,231 | 10.9% |
[ 1.5% - 2.0% ] 1.74% | 87,419 | 7.2% |
[ 1.5% - 2.0% ] 1.93% | 53,323 | 10.1% |
[ 2.0% - 2.5% ] 2.13% | 48,029 | 10.1% |
[ 2.0% - 2.5% ] 2.28% | 55,156 | 10.7% |
[ 2.5% - 3.0% ] 2.51% | 15,979 | 8.2% |
[ 2.5% - 3.0% ] 2.66% | 15,581 | 13.3% |
[ 2.5% - 3.0% ] 2.88% | 67,875 | 8.8% |
[ 3.0% - 3.5% ] 3.00% | 18,307 | 11.6% |
[ 3.0% - 3.5% ] 3.24% | 16,118 | 10.6% |
[ 3.0% - 3.5% ] 3.46% | 7,995 | 10.9% |
[ 3.5% - 4.0% ] 3.58% | 7,909 | 8.5% |
[ 3.5% - 4.0% ] 3.83% | 1,750 | 8.5% |
[ 3.5% - 4.0% ] 3.93% | 2,672 | 9.7% |
[ 4.0% - 4.5% ] 4.14% | 4,957 | 13.6% |
[ 4.0% - 4.5% ] 4.35% | 20,308 | 10.2% |
[ 4.5% - 5.0% ] 4.53% | 26,620 | 4.5% |
[ 4.5% - 5.0% ] 4.71% | 4,290 | 11.7% |
[ 5.0% - 5.5% ] 5.12% | 2,482 | 8.4% |
[ 5.0% - 5.5% ] 5.18% | 40,388 | 7.0% |
[ 5.5% - 6.0% ] 5.57% | 4,419 | 12.3% |
[ 5.5% - 6.0% ] 5.86% | 290 | 13.9% |
[ 5.5% - 6.0% ] 6.00% | 4,318 | 8.3% |
[ 6.0% - 6.5% ] 6.17% | 665 | 11.5% |
[ 6.0% - 6.5% ] 6.36% | 6,967 | 8.8% |
[ 6.5% - 7.0% ] 6.51% | 215 | 8.7% |
[ 6.5% - 7.0% ] 6.65% | 1,234 | 5.9% |
[ 6.5% - 7.0% ] 6.95% | 4,633 | 14.1% |
[ 7.0% - 7.5% ] 7.04% | 1,108 | 7.9% |
[ 7.0% - 7.5% ] 7.28% | 8,632 | 8.7% |
[ 7.0% - 7.5% ] 7.46% | 2,735 | 11.0% |
[ 7.5% - 8.0% ] 7.56% | 6,148 | 7.4% |
[ 7.5% - 8.0% ] 7.91% | 2,061 | 11.5% |
[ 8.0% - 8.5% ] 8.00% | 350 | 8.0% |
[ 8.0% - 8.5% ] 8.21% | 633 | 4.2% |
[ 8.0% - 8.5% ] 8.29% | 4,329 | 11.0% |
[ 8.5% - 9.0% ] 8.61% | 604 | 14.3% |
[ 8.5% - 9.0% ] 8.81% | 919 | 20.8% |
[ 8.5% - 9.0% ] 8.94% | 1,432 | 14.1% |
[ 9.0% - 9.5% ] 9.11% | 966 | 6.1% |
[ 9.0% - 9.5% ] 9.44% | 4,841 | 11.5% |
[ 9.5% - 10.0% ] 9.70% | 268 | 14.0% |
[ 10.0% - 10.5% ] 10.00% | 7,518 | 8.7% |
[ 10.0% - 10.5% ] 10.49% | 286 | 4.8% |
[ 10.5% - 11.0% ] 10.75% | 930 | 4.2% |
[ 10.5% - 11.0% ] 10.95% | 5,491 | 15.0% |
[ 11.0% - 11.5% ] 11.15% | 1,283 | 12.4% |
[ 11.5% - 12.0% ] 11.54% | 208 | 13.1% |
[ 11.5% - 12.0% ] 11.68% | 1,473 | 4.1% |
[ 11.5% - 12.0% ] 11.85% | 16,629 | 3.0% |
[ 11.5% - 12.0% ] 11.98% | 31,368 | 6.8% |
[ 12.0% - 12.5% ] 12.37% | 695 | 7.2% |
[ 13.0% - 13.5% ] 13.12% | 7,470 | 9.0% |
[ 13.0% - 13.5% ] 13.31% | 3,110 | 8.1% |
[ 13.0% - 13.5% ] 13.45% | 119 | 4.3% |
[ 14.5% - 15.0% ] 14.64% | 560 | 9.9% |
[ 15.0% - 15.5% ] 15.00% | 40 | 13.3% |
[ 15.0% - 15.5% ] 15.30% | 791 | 16.4% |
[ 15.5% - 16.0% ] 15.98% | 488 | 7.0% |
[ 16.5% - 17.0% ] 16.79% | 262 | 14.9% |
[ 18.0% - 18.5% ] 18.29% | 82 | 2.4% |
[ 18.0% - 18.5% ] 18.46% | 428 | 4.8% |
[ 21.0% - 21.5% ] 21.05% | 114 | 18.2% |
[ 21.0% - 21.5% ] 21.23% | 212 | 2.5% |
[ 23.5% - 24.0% ] 23.81% | 189 | 2.7% |
[ 25.5% - 26.0% ] 25.74% | 1,286 | 2.0% |