Celtic 4 or more Vehicles in Household
COMPARE
Celtic
Select to Compare
4 or more Vehicles in Household
Celtic 4 or more Vehicles in Household
7.1%
4+ VEHICLES AVAILABLE
99.1/ 100
METRIC RATING
97th/ 347
METRIC RANK
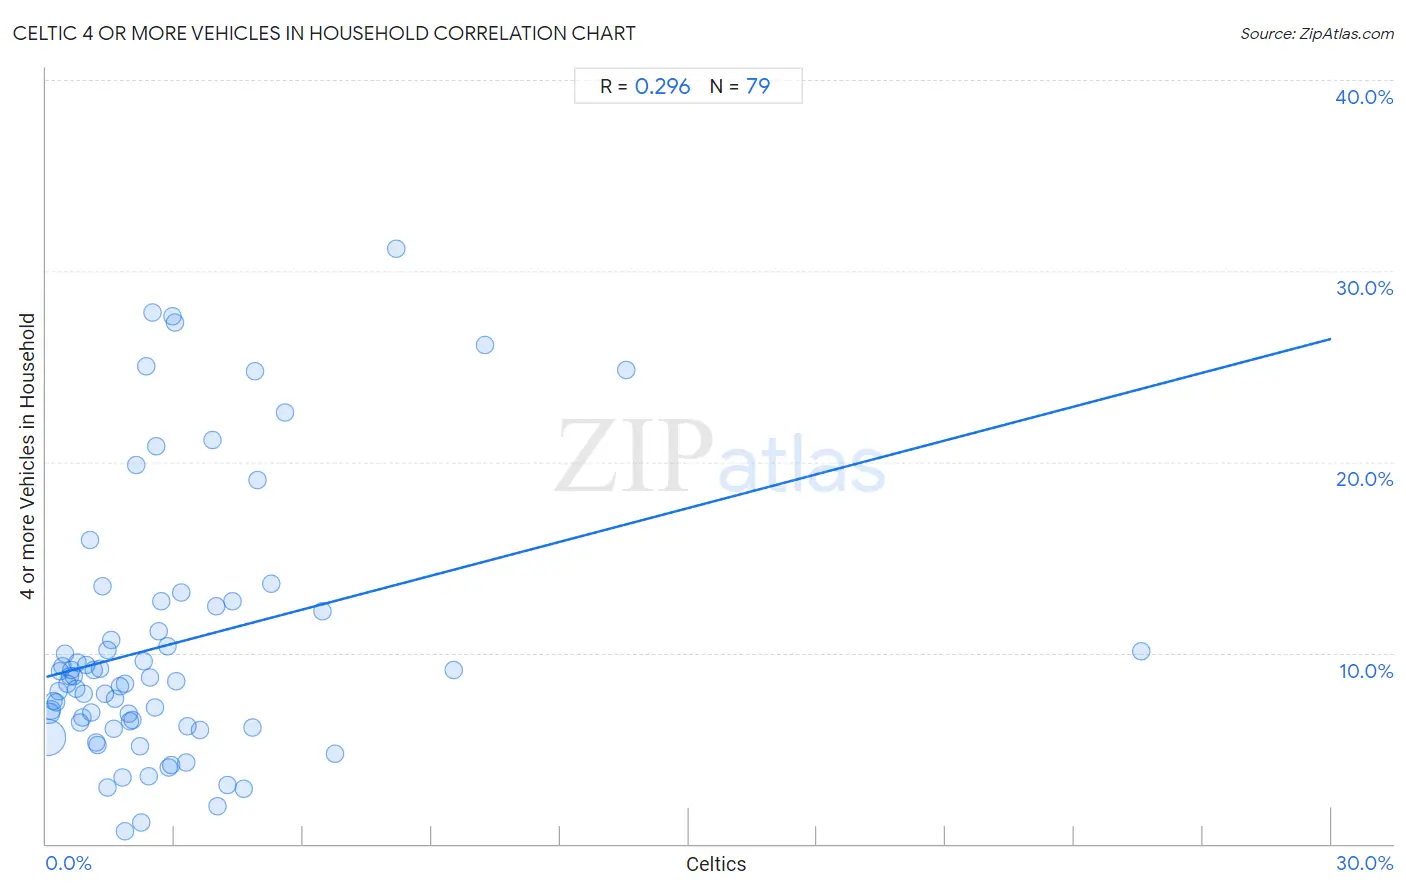
Celtic 4 or more Vehicles in Household Correlation Chart
The statistical analysis conducted on geographies consisting of 168,678,221 people shows a weak positive correlation between the proportion of Celtics and percentage of households with 4 or more vehicles available in the United States with a correlation coefficient (R) of 0.296 and weighted average of 7.1%. On average, for every 1% (one percent) increase in Celtics within a typical geography, there is an increase of 0.59% in percentage of households with 4 or more vehicles available.
It is essential to understand that the correlation between the percentage of Celtics and percentage of households with 4 or more vehicles available does not imply a direct cause-and-effect relationship. It remains uncertain whether the presence of Celtics influences an upward or downward trend in the level of percentage of households with 4 or more vehicles available within an area, or if Celtics simply ended up residing in those areas with higher or lower levels of percentage of households with 4 or more vehicles available due to other factors.
Demographics Similar to Celtics by 4 or more Vehicles in Household
In terms of 4 or more vehicles in household, the demographic groups most similar to Celtics are Central American (7.1%, a difference of 0.35%), Czechoslovakian (7.1%, a difference of 0.37%), Irish (7.1%, a difference of 0.42%), Dutch West Indian (7.1%, a difference of 0.58%), and Immigrants from Afghanistan (7.1%, a difference of 0.59%).
| Demographics | Rating | Rank | 4 or more Vehicles in Household |
| Creek | 99.6 /100 | #90 | Exceptional 7.2% |
| Assyrians/Chaldeans/Syriacs | 99.4 /100 | #91 | Exceptional 7.2% |
| Immigrants from Latin America | 99.4 /100 | #92 | Exceptional 7.1% |
| Immigrants from Afghanistan | 99.3 /100 | #93 | Exceptional 7.1% |
| Dutch West Indians | 99.3 /100 | #94 | Exceptional 7.1% |
| Czechoslovakians | 99.3 /100 | #95 | Exceptional 7.1% |
| Central Americans | 99.3 /100 | #96 | Exceptional 7.1% |
| Celtics | 99.1 /100 | #97 | Exceptional 7.1% |
| Irish | 99.0 /100 | #98 | Exceptional 7.1% |
| Seminole | 98.8 /100 | #99 | Exceptional 7.0% |
| Taiwanese | 98.7 /100 | #100 | Exceptional 7.0% |
| Pakistanis | 98.7 /100 | #101 | Exceptional 7.0% |
| Asians | 98.6 /100 | #102 | Exceptional 7.0% |
| Blackfeet | 98.6 /100 | #103 | Exceptional 7.0% |
| Hmong | 98.3 /100 | #104 | Exceptional 7.0% |
Celtic 4 or more Vehicles in Household Correlation Summary
| Measurement | Celtic Data | 4 or more Vehicles in Household Data |
| Minimum | 0.018% | 0.62% |
| Maximum | 25.6% | 31.2% |
| Range | 25.5% | 30.6% |
| Mean | 2.9% | 10.5% |
| Median | 2.1% | 8.5% |
| Interquartile 25% (IQ1) | 1.0% | 6.1% |
| Interquartile 75% (IQ3) | 3.3% | 12.5% |
| Interquartile Range (IQR) | 2.3% | 6.3% |
| Standard Deviation (Sample) | 3.5% | 7.0% |
| Standard Deviation (Population) | 3.5% | 7.0% |
Correlation Details
| Celtic Percentile | Sample Size | 4 or more Vehicles in Household |
[ 0.0% - 0.5% ] 0.018% | 128,303,433 | 5.6% |
[ 0.0% - 0.5% ] 0.071% | 22,446,673 | 6.8% |
[ 0.0% - 0.5% ] 0.12% | 8,109,535 | 7.0% |
[ 0.0% - 0.5% ] 0.18% | 3,382,500 | 7.5% |
[ 0.0% - 0.5% ] 0.23% | 2,187,799 | 7.4% |
[ 0.0% - 0.5% ] 0.28% | 1,329,282 | 8.0% |
[ 0.0% - 0.5% ] 0.33% | 584,043 | 9.0% |
[ 0.0% - 0.5% ] 0.39% | 409,327 | 9.3% |
[ 0.0% - 0.5% ] 0.44% | 182,804 | 10.0% |
[ 0.0% - 0.5% ] 0.49% | 259,885 | 8.4% |
[ 0.5% - 1.0% ] 0.54% | 204,719 | 8.8% |
[ 0.5% - 1.0% ] 0.59% | 127,165 | 9.1% |
[ 0.5% - 1.0% ] 0.65% | 223,409 | 8.8% |
[ 0.5% - 1.0% ] 0.70% | 98,770 | 8.1% |
[ 0.5% - 1.0% ] 0.73% | 113,922 | 9.5% |
[ 0.5% - 1.0% ] 0.79% | 203,109 | 6.4% |
[ 0.5% - 1.0% ] 0.85% | 41,050 | 6.6% |
[ 0.5% - 1.0% ] 0.89% | 23,937 | 7.9% |
[ 0.5% - 1.0% ] 0.94% | 71,295 | 9.3% |
[ 1.0% - 1.5% ] 1.01% | 25,649 | 15.9% |
[ 1.0% - 1.5% ] 1.06% | 11,331 | 6.9% |
[ 1.0% - 1.5% ] 1.11% | 32,648 | 9.1% |
[ 1.0% - 1.5% ] 1.15% | 36,660 | 5.3% |
[ 1.0% - 1.5% ] 1.20% | 9,327 | 5.1% |
[ 1.0% - 1.5% ] 1.25% | 18,058 | 9.1% |
[ 1.0% - 1.5% ] 1.31% | 8,519 | 13.5% |
[ 1.0% - 1.5% ] 1.38% | 4,428 | 7.8% |
[ 1.0% - 1.5% ] 1.42% | 3,863 | 10.2% |
[ 1.0% - 1.5% ] 1.44% | 12,132 | 2.9% |
[ 1.5% - 2.0% ] 1.51% | 20,802 | 10.7% |
[ 1.5% - 2.0% ] 1.57% | 25,089 | 6.0% |
[ 1.5% - 2.0% ] 1.61% | 11,866 | 7.6% |
[ 1.5% - 2.0% ] 1.71% | 24,800 | 8.2% |
[ 1.5% - 2.0% ] 1.77% | 9,115 | 3.5% |
[ 1.5% - 2.0% ] 1.82% | 10,525 | 8.4% |
[ 1.5% - 2.0% ] 1.85% | 3,084 | 0.62% |
[ 1.5% - 2.0% ] 1.93% | 2,119 | 6.8% |
[ 1.5% - 2.0% ] 1.96% | 3,766 | 6.4% |
[ 2.0% - 2.5% ] 2.02% | 7,741 | 6.5% |
[ 2.0% - 2.5% ] 2.10% | 5,432 | 19.8% |
[ 2.0% - 2.5% ] 2.18% | 12,524 | 5.1% |
[ 2.0% - 2.5% ] 2.22% | 856 | 1.1% |
[ 2.0% - 2.5% ] 2.28% | 1,054 | 9.5% |
[ 2.0% - 2.5% ] 2.34% | 128 | 25.0% |
[ 2.0% - 2.5% ] 2.41% | 16,879 | 3.5% |
[ 2.0% - 2.5% ] 2.44% | 4,597 | 8.7% |
[ 2.0% - 2.5% ] 2.47% | 364 | 27.8% |
[ 2.5% - 3.0% ] 2.54% | 5,560 | 7.1% |
[ 2.5% - 3.0% ] 2.57% | 2,486 | 20.8% |
[ 2.5% - 3.0% ] 2.62% | 3,778 | 11.1% |
[ 2.5% - 3.0% ] 2.69% | 781 | 12.7% |
[ 2.5% - 3.0% ] 2.82% | 71 | 10.3% |
[ 2.5% - 3.0% ] 2.86% | 5,279 | 4.0% |
[ 2.5% - 3.0% ] 2.91% | 3,122 | 4.2% |
[ 2.5% - 3.0% ] 2.95% | 1,220 | 27.6% |
[ 3.0% - 3.5% ] 3.00% | 1,700 | 27.3% |
[ 3.0% - 3.5% ] 3.03% | 726 | 8.5% |
[ 3.0% - 3.5% ] 3.16% | 729 | 13.1% |
[ 3.0% - 3.5% ] 3.27% | 1,468 | 4.3% |
[ 3.0% - 3.5% ] 3.29% | 2,702 | 6.1% |
[ 3.5% - 4.0% ] 3.60% | 2,863 | 5.9% |
[ 3.5% - 4.0% ] 3.88% | 103 | 21.2% |
[ 3.5% - 4.0% ] 3.97% | 604 | 12.5% |
[ 4.0% - 4.5% ] 4.01% | 424 | 2.0% |
[ 4.0% - 4.5% ] 4.22% | 2,298 | 3.1% |
[ 4.0% - 4.5% ] 4.35% | 138 | 12.7% |
[ 4.5% - 5.0% ] 4.60% | 7,087 | 2.9% |
[ 4.5% - 5.0% ] 4.82% | 1,059 | 6.1% |
[ 4.5% - 5.0% ] 4.87% | 1,457 | 24.7% |
[ 4.5% - 5.0% ] 4.94% | 81 | 19.0% |
[ 5.0% - 5.5% ] 5.26% | 38 | 13.6% |
[ 5.5% - 6.0% ] 5.57% | 3,179 | 22.6% |
[ 6.0% - 6.5% ] 6.46% | 681 | 12.2% |
[ 6.5% - 7.0% ] 6.74% | 89 | 4.7% |
[ 8.0% - 8.5% ] 8.17% | 1,396 | 31.2% |
[ 9.5% - 10.0% ] 9.52% | 21 | 9.1% |
[ 10.0% - 10.5% ] 10.26% | 234 | 26.1% |
[ 13.5% - 14.0% ] 13.55% | 251 | 24.8% |
[ 25.5% - 26.0% ] 25.56% | 583 | 10.1% |