Austrian 4 or more Vehicles in Household
COMPARE
Austrian
Select to Compare
4 or more Vehicles in Household
Austrian 4 or more Vehicles in Household
6.8%
4+ VEHICLES AVAILABLE
94.1/ 100
METRIC RATING
125th/ 347
METRIC RANK
Austrian 4 or more Vehicles in Household Correlation Chart
The statistical analysis conducted on geographies consisting of 450,167,430 people shows a moderate positive correlation between the proportion of Austrians and percentage of households with 4 or more vehicles available in the United States with a correlation coefficient (R) of 0.476 and weighted average of 6.8%. On average, for every 1% (one percent) increase in Austrians within a typical geography, there is an increase of 0.63% in percentage of households with 4 or more vehicles available.
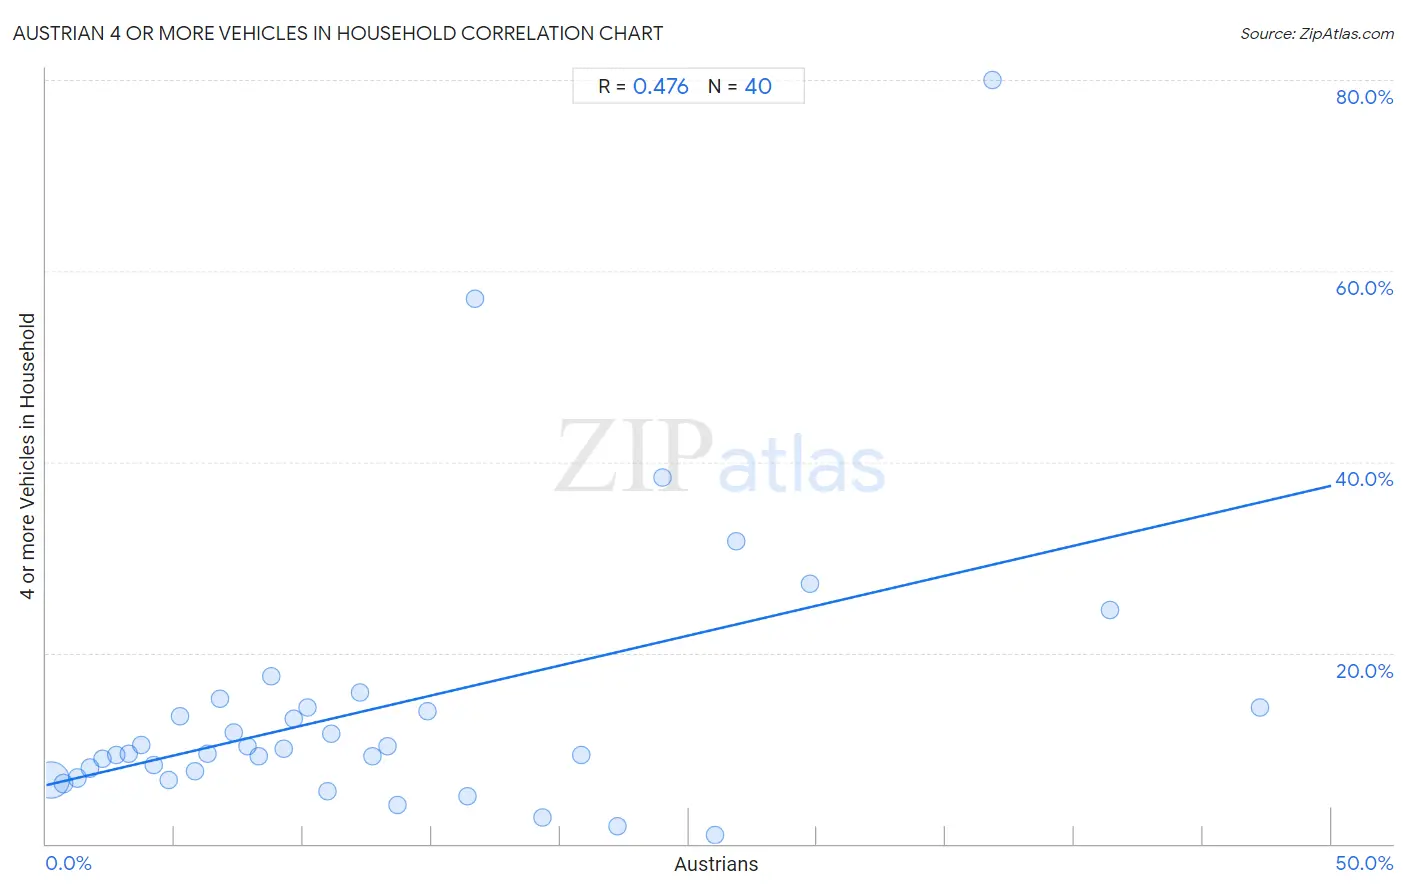
It is essential to understand that the correlation between the percentage of Austrians and percentage of households with 4 or more vehicles available does not imply a direct cause-and-effect relationship. It remains uncertain whether the presence of Austrians influences an upward or downward trend in the level of percentage of households with 4 or more vehicles available within an area, or if Austrians simply ended up residing in those areas with higher or lower levels of percentage of households with 4 or more vehicles available due to other factors.
Demographics Similar to Austrians by 4 or more Vehicles in Household
In terms of 4 or more vehicles in household, the demographic groups most similar to Austrians are Belgian (6.8%, a difference of 0.010%), Immigrants from Asia (6.8%, a difference of 0.10%), Immigrants from Korea (6.8%, a difference of 0.13%), Immigrants (6.8%, a difference of 0.19%), and Immigrants from Germany (6.8%, a difference of 0.26%).
| Demographics | Rating | Rank | 4 or more Vehicles in Household |
| French American Indians | 95.7 /100 | #118 | Exceptional 6.8% |
| Costa Ricans | 95.5 /100 | #119 | Exceptional 6.8% |
| Comanche | 94.8 /100 | #120 | Exceptional 6.8% |
| Immigrants from Germany | 94.7 /100 | #121 | Exceptional 6.8% |
| Immigrants from Nicaragua | 94.7 /100 | #122 | Exceptional 6.8% |
| Immigrants | 94.6 /100 | #123 | Exceptional 6.8% |
| Immigrants from Asia | 94.4 /100 | #124 | Exceptional 6.8% |
| Austrians | 94.1 /100 | #125 | Exceptional 6.8% |
| Belgians | 94.1 /100 | #126 | Exceptional 6.8% |
| Immigrants from Korea | 93.8 /100 | #127 | Exceptional 6.8% |
| Immigrants from Bolivia | 92.5 /100 | #128 | Exceptional 6.7% |
| Immigrants from England | 92.0 /100 | #129 | Exceptional 6.7% |
| Immigrants from Scotland | 89.0 /100 | #130 | Excellent 6.7% |
| Maltese | 88.4 /100 | #131 | Excellent 6.7% |
| Immigrants from Netherlands | 87.8 /100 | #132 | Excellent 6.6% |
Austrian 4 or more Vehicles in Household Correlation Summary
| Measurement | Austrian Data | 4 or more Vehicles in Household Data |
| Minimum | 0.17% | 0.94% |
| Maximum | 47.2% | 80.0% |
| Range | 47.1% | 79.1% |
| Mean | 13.1% | 14.4% |
| Median | 9.9% | 9.7% |
| Interquartile 25% (IQ1) | 5.0% | 7.2% |
| Interquartile 75% (IQ3) | 18.0% | 14.3% |
| Interquartile Range (IQR) | 13.0% | 7.1% |
| Standard Deviation (Sample) | 11.3% | 14.9% |
| Standard Deviation (Population) | 11.2% | 14.7% |
Correlation Details
| Austrian Percentile | Sample Size | 4 or more Vehicles in Household |
[ 0.0% - 0.5% ] 0.17% | 405,426,601 | 6.7% |
[ 0.5% - 1.0% ] 0.67% | 36,129,464 | 6.3% |
[ 1.0% - 1.5% ] 1.20% | 5,995,992 | 6.9% |
[ 1.5% - 2.0% ] 1.70% | 1,478,983 | 7.9% |
[ 2.0% - 2.5% ] 2.20% | 455,888 | 8.9% |
[ 2.5% - 3.0% ] 2.70% | 257,203 | 9.4% |
[ 3.0% - 3.5% ] 3.20% | 129,774 | 9.5% |
[ 3.5% - 4.0% ] 3.71% | 102,262 | 10.3% |
[ 4.0% - 4.5% ] 4.18% | 72,069 | 8.2% |
[ 4.5% - 5.0% ] 4.79% | 28,108 | 6.7% |
[ 5.0% - 5.5% ] 5.21% | 16,090 | 13.4% |
[ 5.5% - 6.0% ] 5.77% | 11,753 | 7.6% |
[ 6.0% - 6.5% ] 6.26% | 12,352 | 9.4% |
[ 6.5% - 7.0% ] 6.75% | 6,582 | 15.1% |
[ 7.0% - 7.5% ] 7.30% | 9,210 | 11.6% |
[ 7.5% - 8.0% ] 7.81% | 6,238 | 10.2% |
[ 8.0% - 8.5% ] 8.29% | 1,062 | 9.1% |
[ 8.5% - 9.0% ] 8.75% | 2,801 | 17.5% |
[ 9.0% - 9.5% ] 9.25% | 1,438 | 10.0% |
[ 9.5% - 10.0% ] 9.62% | 3,878 | 13.1% |
[ 10.0% - 10.5% ] 10.18% | 2,200 | 14.3% |
[ 10.5% - 11.0% ] 10.93% | 2,680 | 5.5% |
[ 11.0% - 11.5% ] 11.09% | 595 | 11.5% |
[ 12.0% - 12.5% ] 12.20% | 844 | 15.9% |
[ 12.5% - 13.0% ] 12.68% | 5,993 | 9.2% |
[ 13.0% - 13.5% ] 13.26% | 377 | 10.2% |
[ 13.5% - 14.0% ] 13.68% | 117 | 4.0% |
[ 14.5% - 15.0% ] 14.84% | 1,294 | 13.9% |
[ 16.0% - 16.5% ] 16.38% | 2,802 | 5.0% |
[ 16.5% - 17.0% ] 16.67% | 12 | 57.1% |
[ 19.0% - 19.5% ] 19.31% | 378 | 2.7% |
[ 20.5% - 21.0% ] 20.80% | 577 | 9.3% |
[ 22.0% - 22.5% ] 22.22% | 72 | 1.8% |
[ 23.5% - 24.0% ] 23.95% | 526 | 38.3% |
[ 26.0% - 26.5% ] 26.04% | 192 | 0.94% |
[ 26.5% - 27.0% ] 26.84% | 652 | 31.7% |
[ 29.5% - 30.0% ] 29.70% | 101 | 27.3% |
[ 36.5% - 37.0% ] 36.84% | 19 | 80.0% |
[ 41.0% - 41.5% ] 41.40% | 215 | 24.5% |
[ 47.0% - 47.5% ] 47.22% | 36 | 14.3% |