Houma Receiving Food Stamps
COMPARE
Houma
Select to Compare
Receiving Food Stamps
Houma Receiving Food Stamps
16.5%
PUBLIC INCOME | FOOD STAMPS
0.0/ 100
METRIC RATING
307th/ 347
METRIC RANK
Houma Receiving Food Stamps Correlation Chart
The statistical analysis conducted on geographies consisting of 36,773,946 people shows a substantial positive correlation between the proportion of Houma and percentage of population receiving government assistance and/or food stamps in the United States with a correlation coefficient (R) of 0.581 and weighted average of 16.5%. On average, for every 1% (one percent) increase in Houma within a typical geography, there is an increase of 0.36% in percentage of population receiving government assistance and/or food stamps.
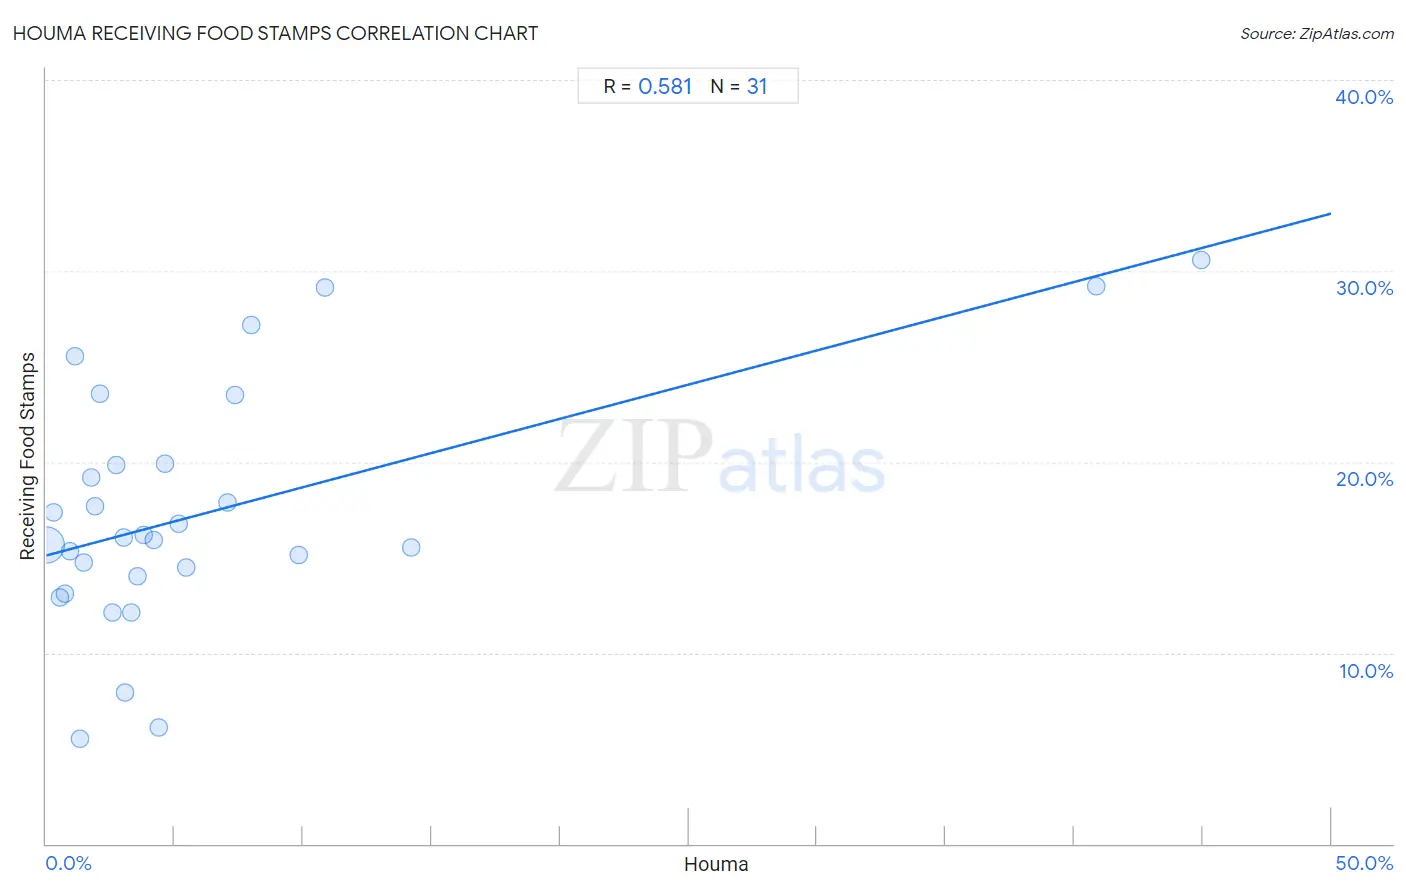
It is essential to understand that the correlation between the percentage of Houma and percentage of population receiving government assistance and/or food stamps does not imply a direct cause-and-effect relationship. It remains uncertain whether the presence of Houma influences an upward or downward trend in the level of percentage of population receiving government assistance and/or food stamps within an area, or if Houma simply ended up residing in those areas with higher or lower levels of percentage of population receiving government assistance and/or food stamps due to other factors.
Demographics Similar to Houma by Receiving Food Stamps
In terms of receiving food stamps, the demographic groups most similar to Houma are Barbadian (16.5%, a difference of 0.26%), Jamaican (16.4%, a difference of 0.29%), Immigrants from the Azores (16.4%, a difference of 0.35%), U.S. Virgin Islander (16.5%, a difference of 0.50%), and Immigrants from Barbados (16.6%, a difference of 1.1%).
| Demographics | Rating | Rank | Receiving Food Stamps |
| Immigrants from Bangladesh | 0.0 /100 | #300 | Tragic 15.9% |
| Trinidadians and Tobagonians | 0.0 /100 | #301 | Tragic 16.0% |
| Immigrants from West Indies | 0.0 /100 | #302 | Tragic 16.1% |
| Nicaraguans | 0.0 /100 | #303 | Tragic 16.1% |
| West Indians | 0.0 /100 | #304 | Tragic 16.3% |
| Immigrants from the Azores | 0.0 /100 | #305 | Tragic 16.4% |
| Jamaicans | 0.0 /100 | #306 | Tragic 16.4% |
| Houma | 0.0 /100 | #307 | Tragic 16.5% |
| Barbadians | 0.0 /100 | #308 | Tragic 16.5% |
| U.S. Virgin Islanders | 0.0 /100 | #309 | Tragic 16.5% |
| Immigrants from Barbados | 0.0 /100 | #310 | Tragic 16.6% |
| Guyanese | 0.0 /100 | #311 | Tragic 16.7% |
| Sioux | 0.0 /100 | #312 | Tragic 16.8% |
| Immigrants from Jamaica | 0.0 /100 | #313 | Tragic 16.9% |
| Immigrants from Guyana | 0.0 /100 | #314 | Tragic 16.9% |
Houma Receiving Food Stamps Correlation Summary
| Measurement | Houma Data | Receiving Food Stamps Data |
| Minimum | 0.012% | 5.5% |
| Maximum | 44.9% | 30.6% |
| Range | 44.9% | 25.1% |
| Mean | 6.5% | 17.4% |
| Median | 3.3% | 16.0% |
| Interquartile 25% (IQ1) | 1.5% | 14.0% |
| Interquartile 75% (IQ3) | 7.0% | 19.9% |
| Interquartile Range (IQR) | 5.6% | 5.9% |
| Standard Deviation (Sample) | 10.3% | 6.3% |
| Standard Deviation (Population) | 10.1% | 6.2% |
Correlation Details
| Houma Percentile | Sample Size | Receiving Food Stamps |
[ 0.0% - 0.5% ] 0.012% | 35,238,508 | 15.6% |
[ 0.0% - 0.5% ] 0.28% | 570,558 | 17.3% |
[ 0.5% - 1.0% ] 0.52% | 304,570 | 12.9% |
[ 0.5% - 1.0% ] 0.71% | 264,900 | 13.1% |
[ 0.5% - 1.0% ] 0.93% | 85,949 | 15.3% |
[ 1.0% - 1.5% ] 1.10% | 43,230 | 25.5% |
[ 1.0% - 1.5% ] 1.32% | 4,401 | 5.5% |
[ 1.0% - 1.5% ] 1.47% | 25,087 | 14.7% |
[ 1.5% - 2.0% ] 1.77% | 15,031 | 19.2% |
[ 1.5% - 2.0% ] 1.89% | 11,415 | 17.7% |
[ 2.0% - 2.5% ] 2.09% | 8,600 | 23.5% |
[ 2.5% - 3.0% ] 2.58% | 9,287 | 12.1% |
[ 2.5% - 3.0% ] 2.71% | 7,961 | 19.8% |
[ 2.5% - 3.0% ] 3.00% | 26,788 | 16.0% |
[ 3.0% - 3.5% ] 3.09% | 5,118 | 7.9% |
[ 3.0% - 3.5% ] 3.31% | 5,677 | 12.1% |
[ 3.5% - 4.0% ] 3.56% | 33,094 | 14.0% |
[ 3.5% - 4.0% ] 3.79% | 15,373 | 16.2% |
[ 4.0% - 4.5% ] 4.21% | 11,624 | 15.9% |
[ 4.0% - 4.5% ] 4.40% | 2,386 | 6.1% |
[ 4.5% - 5.0% ] 4.63% | 30,192 | 19.9% |
[ 5.0% - 5.5% ] 5.16% | 35,760 | 16.7% |
[ 5.0% - 5.5% ] 5.46% | 5,845 | 14.5% |
[ 7.0% - 7.5% ] 7.04% | 3,762 | 17.9% |
[ 7.0% - 7.5% ] 7.34% | 286 | 23.5% |
[ 7.5% - 8.0% ] 7.99% | 2,880 | 27.2% |
[ 9.5% - 10.0% ] 9.84% | 2,511 | 15.1% |
[ 10.5% - 11.0% ] 10.82% | 194 | 29.1% |
[ 14.0% - 14.5% ] 14.18% | 1,347 | 15.5% |
[ 40.5% - 41.0% ] 40.88% | 844 | 29.2% |
[ 44.5% - 45.0% ] 44.92% | 768 | 30.6% |