Houma 2 or more Vehicles in Household

COMPARE

Houma
Race
Ancestry
AfghanAfricanAlaska NativeAlaskan AthabascanAlbanianAleutAlsatianAmericanApacheArabArapahoArgentineanArmenianAssyrian/Chaldean/SyriacAustralianAustrianBahamianBangladeshiBarbadianBasqueBelgianBelizeanBermudanBhutaneseBlackfeetBolivianBrazilianBritishBritish West IndianBulgarianBurmeseCajunCambodianCanadianCape VerdeanCarpatho RusynCelticCentral AmericanCentral American IndianCherokeeCheyenneChickasawChileanChineseChippewaChoctawColombianColvilleComancheCosta RicanCreeCreekCroatianCrowCubanCypriotCzechCzechoslovakianDanishDelawareDominicanDutchDutch West IndianEastern EuropeanEcuadorianEgyptianEnglishEstonianEthiopianEuropeanFijianFilipinoFinnishFrenchFrench American IndianFrench CanadianGermanGerman RussianGhanaianGreekGuamanian/ChamorroGuatemalanGuyaneseHaitianHmongHonduranHopiHoumaHungarianIcelanderIndian (Asian)IndonesianInupiatIranianIraqiIrishIroquoisIsraeliItalianJamaicanJapaneseJordanianKenyanKiowaKoreanLaotianLatvianLebaneseLiberianLithuanianLumbeeLuxembourgerMacedonianMalaysianMalteseMarshalleseMenomineeMexicanMexican American IndianMongolianMoroccanNative HawaiianNavajoNepaleseNew ZealanderNicaraguanNigerianNorthern EuropeanNorwegianOkinawanOsageOttawaPaiutePakistaniPalestinianPanamanianParaguayanPennsylvania GermanPeruvianPimaPolishPortuguesePotawatomiPuebloPuerto RicanPuget Sound SalishRomanianRussianSalvadoranSamoanScandinavianScotch-IrishScottishSeminoleSenegaleseSerbianShoshoneSierra LeoneanSiouxSlavicSlovakSloveneSomaliSouth AfricanSouth AmericanSouth American IndianSoviet UnionSpaniardSpanishSpanish AmericanSpanish American IndianSri LankanSubsaharan AfricanSudaneseSwedishSwissSyrianTaiwaneseThaiTlingit-HaidaTohono O'OdhamTonganTrinidadian and TobagonianTsimshianTurkishU.S. Virgin IslanderUgandanUkrainianUruguayanUteVenezuelanVietnameseWelshWest IndianYakamaYaquiYugoslavianYumanYup'ikZimbabwean
Immigration
NonimmigrantsImmigrantsAfghanistanAfricaAlbaniaArgentinaArmeniaAsiaAustraliaAustriaBahamasBangladeshBarbadosBelarusBelgiumBelizeBoliviaBosnia and HerzegovinaBrazilBulgariaBurma/MyanmarCabo VerdeCambodiaCameroonCanadaCaribbeanCentral AmericaChileChinaColombiaCongoCosta RicaCroatiaCubaCzechoslovakiaDenmarkDominicaDominican RepublicEastern AfricaEastern AsiaEastern EuropeEcuadorEgyptEl SalvadorEnglandEritreaEthiopiaEuropeFijiFranceGermanyGhanaGreeceGrenadaGuatemalaGuyanaHaitiHondurasHong KongHungaryIndiaIndonesiaIranIraqIrelandIsraelItalyJamaicaJapanJordanKazakhstanKenyaKoreaKuwaitLaosLatin AmericaLatviaLebanonLiberiaLithuaniaMalaysiaMexicoMicronesiaMiddle AfricaMoldovaMoroccoNepalNetherlandsNicaraguaNigeriaNorth AmericaNorth MacedoniaNorthern AfricaNorthern EuropeNorwayOceaniaPakistanPanamaPeruPhilippinesPolandPortugalRomaniaRussiaSaudi ArabiaScotlandSenegalSerbiaSierra LeoneSingaporeSomaliaSouth AfricaSouth AmericaSouth Central AsiaSouth Eastern AsiaSouthern EuropeSpainSri LankaSt. Vincent and the GrenadinesSudanSwedenSwitzerlandSyriaTaiwanThailandTrinidad and TobagoTurkeyUgandaUkraineUruguayUzbekistanVenezuelaVietnamWest IndiesWestern AfricaWestern AsiaWestern EuropeYemenZaireZimbabweAzores
Select to Compare
Race
Ancestry
AfghanAfricanAlaska NativeAlaskan AthabascanAlbanianAleutAlsatianAmericanApacheArabArapahoArgentineanArmenianAssyrian/Chaldean/SyriacAustralianAustrianBahamianBangladeshiBarbadianBasqueBelgianBelizeanBermudanBhutaneseBlackfeetBolivianBrazilianBritishBritish West IndianBulgarianBurmeseCajunCambodianCanadianCape VerdeanCarpatho RusynCelticCentral AmericanCentral American IndianCherokeeCheyenneChickasawChileanChineseChippewaChoctawColombianColvilleComancheCosta RicanCreeCreekCroatianCrowCubanCypriotCzechCzechoslovakianDanishDelawareDominicanDutchDutch West IndianEastern EuropeanEcuadorianEgyptianEnglishEstonianEthiopianEuropeanFijianFilipinoFinnishFrenchFrench American IndianFrench CanadianGermanGerman RussianGhanaianGreekGuamanian/ChamorroGuatemalanGuyaneseHaitianHmongHonduranHopiHungarianIcelanderIndian (Asian)IndonesianInupiatIranianIraqiIrishIroquoisIsraeliItalianJamaicanJapaneseJordanianKenyanKiowaKoreanLaotianLatvianLebaneseLiberianLithuanianLumbeeLuxembourgerMacedonianMalaysianMalteseMarshalleseMenomineeMexicanMexican American IndianMongolianMoroccanNative HawaiianNavajoNepaleseNew ZealanderNicaraguanNigerianNorthern EuropeanNorwegianOkinawanOsageOttawaPaiutePakistaniPalestinianPanamanianParaguayanPennsylvania GermanPeruvianPimaPolishPortuguesePotawatomiPuebloPuerto RicanPuget Sound SalishRomanianRussianSalvadoranSamoanScandinavianScotch-IrishScottishSeminoleSenegaleseSerbianShoshoneSierra LeoneanSiouxSlavicSlovakSloveneSomaliSouth AfricanSouth AmericanSouth American IndianSoviet UnionSpaniardSpanishSpanish AmericanSpanish American IndianSri LankanSubsaharan AfricanSudaneseSwedishSwissSyrianTaiwaneseThaiTlingit-HaidaTohono O'OdhamTonganTrinidadian and TobagonianTsimshianTurkishU.S. Virgin IslanderUgandanUkrainianUruguayanUteVenezuelanVietnameseWelshWest IndianYakamaYaquiYugoslavianYumanYup'ikZimbabwean
Immigration
NonimmigrantsImmigrantsAfghanistanAfricaAlbaniaArgentinaArmeniaAsiaAustraliaAustriaBahamasBangladeshBarbadosBelarusBelgiumBelizeBoliviaBosnia and HerzegovinaBrazilBulgariaBurma/MyanmarCabo VerdeCambodiaCameroonCanadaCaribbeanCentral AmericaChileChinaColombiaCongoCosta RicaCroatiaCubaCzechoslovakiaDenmarkDominicaDominican RepublicEastern AfricaEastern AsiaEastern EuropeEcuadorEgyptEl SalvadorEnglandEritreaEthiopiaEuropeFijiFranceGermanyGhanaGreeceGrenadaGuatemalaGuyanaHaitiHondurasHong KongHungaryIndiaIndonesiaIranIraqIrelandIsraelItalyJamaicaJapanJordanKazakhstanKenyaKoreaKuwaitLaosLatin AmericaLatviaLebanonLiberiaLithuaniaMalaysiaMexicoMicronesiaMiddle AfricaMoldovaMoroccoNepalNetherlandsNicaraguaNigeriaNorth AmericaNorth MacedoniaNorthern AfricaNorthern EuropeNorwayOceaniaPakistanPanamaPeruPhilippinesPolandPortugalRomaniaRussiaSaudi ArabiaScotlandSenegalSerbiaSierra LeoneSingaporeSomaliaSouth AfricaSouth AmericaSouth Central AsiaSouth Eastern AsiaSouthern EuropeSpainSri LankaSt. Vincent and the GrenadinesSudanSwedenSwitzerlandSyriaTaiwanThailandTrinidad and TobagoTurkeyUgandaUkraineUruguayUzbekistanVenezuelaVietnamWest IndiesWestern AfricaWestern AsiaWestern EuropeYemenZaireZimbabweAzores
2 or more Vehicles in Household
Income
Poverty
Unemployment
Labor Participation
Family Structure
Vehicle Availability
Education Level
Disability

Houma 2 or more Vehicles in Household
Poor

54.4%
2+ VEHICLES AVAILABLE
15.8/ 100
METRIC RATING
200th/ 347
METRIC RANK

Houma 2 or more Vehicles in Household Correlation Chart

The statistical analysis conducted on geographies consisting of 36,796,778 people shows a significant negative correlation between the proportion of Houma and percentage of households with 2 or more vehicles available in the United States with a correlation coefficient (R) of -0.633 and weighted average of 54.4%. On average, for every 1% (one percent) increase in Houma within a typical geography, there is a decrease of 0.83% in percentage of households with 2 or more vehicles available.
Houma 2 or more Vehicles in Household
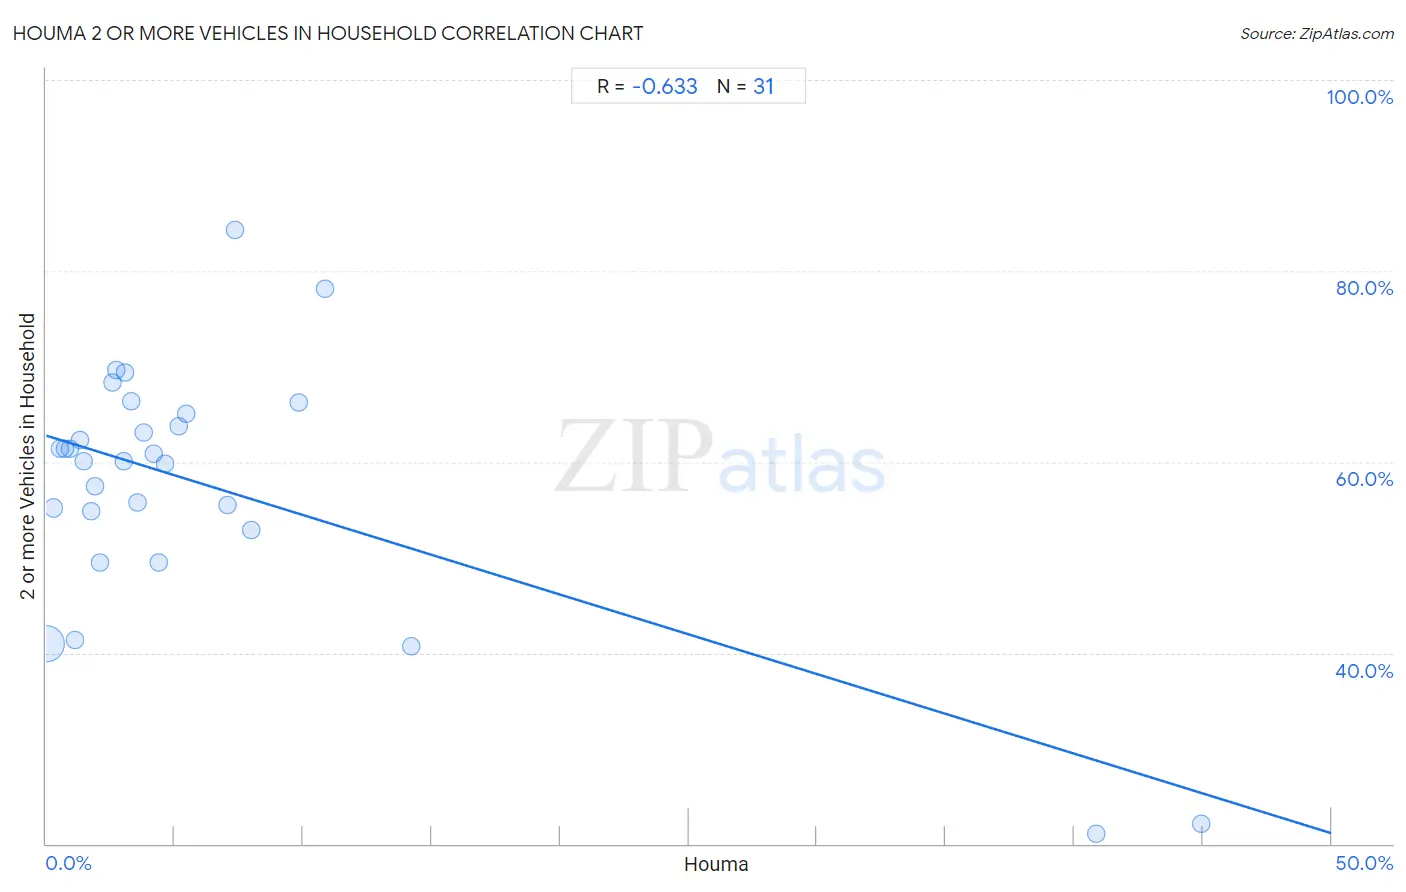
It is essential to understand that the correlation between the percentage of Houma and percentage of households with 2 or more vehicles available does not imply a direct cause-and-effect relationship. It remains uncertain whether the presence of Houma influences an upward or downward trend in the level of percentage of households with 2 or more vehicles available within an area, or if Houma simply ended up residing in those areas with higher or lower levels of percentage of households with 2 or more vehicles available due to other factors.

Demographics Similar to Houma by 2 or more Vehicles in Household

In terms of 2 or more vehicles in household, the demographic groups most similar to Houma are Immigrants from Norway (54.4%, a difference of 0.0%), Carpatho Rusyn (54.4%, a difference of 0.030%), Immigrants from Italy (54.4%, a difference of 0.030%), Immigrants from North Macedonia (54.4%, a difference of 0.070%), and Argentinean (54.5%, a difference of 0.12%).
DemographicsRating | Rank2 or more Vehicles in Household
Immigrants from Japan
23.4
/100
|
#193
Fair
54.7%
Central Americans
23.0
/100
|
#194
Fair
54.7%
Iroquois
22.6
/100
|
#195
Fair
54.7%
Immigrants from Poland
19.3
/100
|
#196
Poor
54.6%
Argentineans
17.5
/100
|
#197
Poor
54.5%
Carpatho Rusyns
16.2
/100
|
#198
Poor
54.4%
Immigrants from Norway
15.9
/100
|
#199
Poor
54.4%
Houma
15.8
/100
|
#200
Poor
54.4%
Immigrants from Italy
15.5
/100
|
#201
Poor
54.4%
Immigrants from North Macedonia
14.9
/100
|
#202
Poor
54.4%
Immigrants from Peru
14.3
/100
|
#203
Poor
54.4%
Immigrants from Belgium
13.7
/100
|
#204
Poor
54.3%
Cheyenne
13.6
/100
|
#205
Poor
54.3%
Immigrants from Latin America
13.1
/100
|
#206
Poor
54.3%
Turks
13.0
/100
|
#207
Poor
54.3%

Houma 2 or more Vehicles in Household Correlation Summary

MeasurementHouma Data2 or more Vehicles in Household Data
Minimum0.012%21.1%
Maximum44.9%84.3%
Range44.9%63.2%
Mean6.5%57.4%
Median3.3%60.1%
Interquartile 25% (IQ1)1.5%52.8%
Interquartile 75% (IQ3)7.0%65.0%
Interquartile Range (IQR)5.6%12.2%
Standard Deviation (Sample)10.3%13.5%
Standard Deviation (Population)10.1%13.3%

Correlation Details

Houma PercentileSample Size2 or more Vehicles in Household
[
0.0%
-
0.5%
]
0.012%
35,258,01741.0%
[
0.0%
-
0.5%
]
0.28%
573,73755.2%
[
0.5%
-
1.0%
]
0.52%
304,57061.4%
[
0.5%
-
1.0%
]
0.71%
264,90061.4%
[
0.5%
-
1.0%
]
0.93%
85,94961.3%
[
1.0%
-
1.5%
]
1.10%
43,23041.4%
[
1.0%
-
1.5%
]
1.32%
4,54562.3%
[
1.0%
-
1.5%
]
1.47%
25,08760.0%
[
1.5%
-
2.0%
]
1.77%
15,03154.8%
[
1.5%
-
2.0%
]
1.89%
11,41557.4%
[
2.0%
-
2.5%
]
2.09%
8,60049.5%
[
2.5%
-
3.0%
]
2.58%
9,28768.3%
[
2.5%
-
3.0%
]
2.71%
7,96169.6%
[
2.5%
-
3.0%
]
3.00%
26,78860.1%
[
3.0%
-
3.5%
]
3.09%
5,11869.4%
[
3.0%
-
3.5%
]
3.31%
5,67766.4%
[
3.5%
-
4.0%
]
3.56%
33,09455.8%
[
3.5%
-
4.0%
]
3.79%
15,37363.1%
[
4.0%
-
4.5%
]
4.21%
11,62460.9%
[
4.0%
-
4.5%
]
4.40%
2,38649.5%
[
4.5%
-
5.0%
]
4.63%
30,19259.8%
[
5.0%
-
5.5%
]
5.16%
35,76063.7%
[
5.0%
-
5.5%
]
5.46%
5,84565.0%
[
7.0%
-
7.5%
]
7.04%
3,76255.5%
[
7.0%
-
7.5%
]
7.34%
28684.3%
[
7.5%
-
8.0%
]
7.99%
2,88052.8%
[
9.5%
-
10.0%
]
9.84%
2,51166.3%
[
10.5%
-
11.0%
]
10.82%
19478.2%
[
14.0%
-
14.5%
]
14.18%
1,34740.6%
[
40.5%
-
41.0%
]
40.88%
84421.1%
[
44.5%
-
45.0%
]
44.92%
76822.1%