Houma Disability Age Under 5
COMPARE
Houma
Select to Compare
Disability Age Under 5
Houma Disability Age Under 5
1.9%
DISABILITY | AGE UNDER 5
0.0/ 100
METRIC RATING
329th/ 347
METRIC RANK
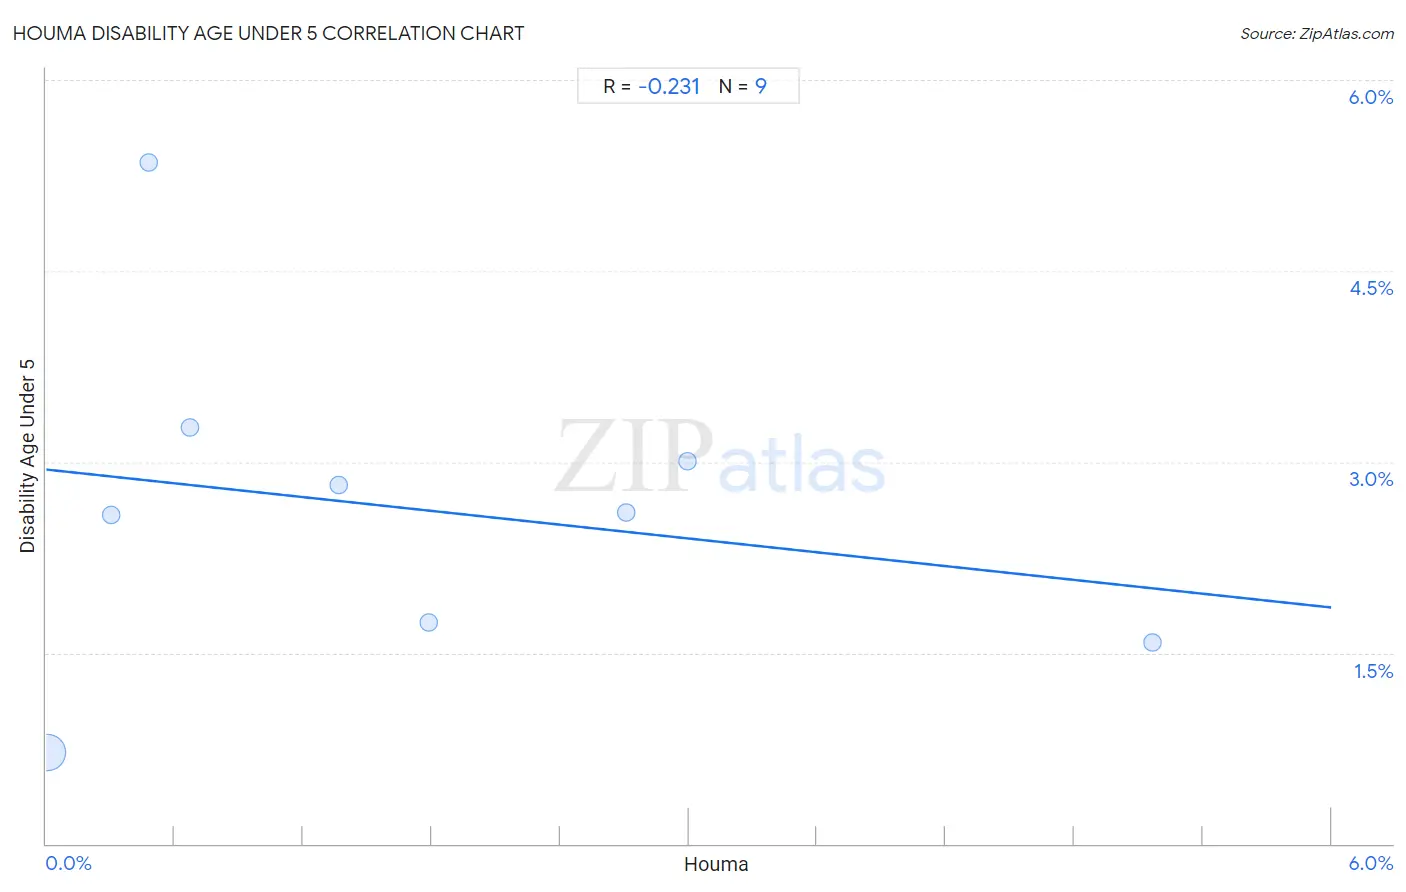
Houma Disability Age Under 5 Correlation Chart
The statistical analysis conducted on geographies consisting of 31,359,385 people shows a weak negative correlation between the proportion of Houma and percentage of population with a disability under the age of 5 in the United States with a correlation coefficient (R) of -0.231 and weighted average of 1.9%. On average, for every 1% (one percent) increase in Houma within a typical geography, there is a decrease of 0.18% in percentage of population with a disability under the age of 5.
It is essential to understand that the correlation between the percentage of Houma and percentage of population with a disability under the age of 5 does not imply a direct cause-and-effect relationship. It remains uncertain whether the presence of Houma influences an upward or downward trend in the level of percentage of population with a disability under the age of 5 within an area, or if Houma simply ended up residing in those areas with higher or lower levels of percentage of population with a disability under the age of 5 due to other factors.
Demographics Similar to Houma by Disability Age Under 5
In terms of disability age under 5, the demographic groups most similar to Houma are Choctaw (1.9%, a difference of 0.32%), American (1.9%, a difference of 0.47%), French Canadian (1.9%, a difference of 0.62%), Chippewa (1.9%, a difference of 0.69%), and Osage (1.8%, a difference of 2.2%).
| Demographics | Rating | Rank | Disability Age Under 5 |
| Germans | 0.0 /100 | #322 | Tragic 1.7% |
| Chickasaw | 0.0 /100 | #323 | Tragic 1.7% |
| Cherokee | 0.0 /100 | #324 | Tragic 1.8% |
| Immigrants from Portugal | 0.0 /100 | #325 | Tragic 1.8% |
| Sioux | 0.0 /100 | #326 | Tragic 1.8% |
| Osage | 0.0 /100 | #327 | Tragic 1.8% |
| Americans | 0.0 /100 | #328 | Tragic 1.9% |
| Houma | 0.0 /100 | #329 | Tragic 1.9% |
| Choctaw | 0.0 /100 | #330 | Tragic 1.9% |
| French Canadians | 0.0 /100 | #331 | Tragic 1.9% |
| Chippewa | 0.0 /100 | #332 | Tragic 1.9% |
| Dutch West Indians | 0.0 /100 | #333 | Tragic 1.9% |
| Natives/Alaskans | 0.0 /100 | #334 | Tragic 1.9% |
| Pennsylvania Germans | 0.0 /100 | #335 | Tragic 1.9% |
| Paraguayans | 0.0 /100 | #336 | Tragic 2.0% |
Houma Disability Age Under 5 Correlation Summary
| Measurement | Houma Data | Disability Age Under 5 Data |
| Minimum | 0.0080% | 0.72% |
| Maximum | 5.2% | 5.4% |
| Range | 5.2% | 4.6% |
| Mean | 1.7% | 2.6% |
| Median | 1.4% | 2.6% |
| Interquartile 25% (IQ1) | 0.39% | 1.7% |
| Interquartile 75% (IQ3) | 2.9% | 3.1% |
| Interquartile Range (IQR) | 2.5% | 1.5% |
| Standard Deviation (Sample) | 1.7% | 1.3% |
| Standard Deviation (Population) | 1.6% | 1.2% |
Correlation Details
| Houma Percentile | Sample Size | Disability Age Under 5 |
[ 0.0% - 0.5% ] 0.0080% | 30,923,509 | 0.72% |
[ 0.0% - 0.5% ] 0.30% | 205,071 | 2.6% |
[ 0.0% - 0.5% ] 0.48% | 61,588 | 5.4% |
[ 0.5% - 1.0% ] 0.67% | 101,054 | 3.3% |
[ 1.0% - 1.5% ] 1.37% | 951 | 2.8% |
[ 1.5% - 2.0% ] 1.79% | 9,843 | 1.7% |
[ 2.5% - 3.0% ] 2.71% | 5,951 | 2.6% |
[ 2.5% - 3.0% ] 3.00% | 21,727 | 3.0% |
[ 5.0% - 5.5% ] 5.16% | 29,691 | 1.6% |