Houma Married-Couple Family Poverty

COMPARE

Houma
Race
Ancestry
AfghanAfricanAlaska NativeAlaskan AthabascanAlbanianAleutAlsatianAmericanApacheArabArapahoArgentineanArmenianAssyrian/Chaldean/SyriacAustralianAustrianBahamianBangladeshiBarbadianBasqueBelgianBelizeanBermudanBhutaneseBlackfeetBolivianBrazilianBritishBritish West IndianBulgarianBurmeseCajunCambodianCanadianCape VerdeanCarpatho RusynCelticCentral AmericanCentral American IndianCherokeeCheyenneChickasawChileanChineseChippewaChoctawColombianColvilleComancheCosta RicanCreeCreekCroatianCrowCubanCypriotCzechCzechoslovakianDanishDelawareDominicanDutchDutch West IndianEastern EuropeanEcuadorianEgyptianEnglishEstonianEthiopianEuropeanFijianFilipinoFinnishFrenchFrench American IndianFrench CanadianGermanGerman RussianGhanaianGreekGuamanian/ChamorroGuatemalanGuyaneseHaitianHmongHonduranHopiHoumaHungarianIcelanderIndian (Asian)IndonesianInupiatIranianIraqiIrishIroquoisIsraeliItalianJamaicanJapaneseJordanianKenyanKiowaKoreanLaotianLatvianLebaneseLiberianLithuanianLumbeeLuxembourgerMacedonianMalaysianMalteseMarshalleseMenomineeMexicanMexican American IndianMongolianMoroccanNative HawaiianNavajoNepaleseNew ZealanderNicaraguanNigerianNorthern EuropeanNorwegianOkinawanOsageOttawaPaiutePakistaniPalestinianPanamanianParaguayanPennsylvania GermanPeruvianPimaPolishPortuguesePotawatomiPuebloPuerto RicanPuget Sound SalishRomanianRussianSalvadoranSamoanScandinavianScotch-IrishScottishSeminoleSenegaleseSerbianShoshoneSierra LeoneanSiouxSlavicSlovakSloveneSomaliSouth AfricanSouth AmericanSouth American IndianSoviet UnionSpaniardSpanishSpanish AmericanSpanish American IndianSri LankanSubsaharan AfricanSudaneseSwedishSwissSyrianTaiwaneseThaiTlingit-HaidaTohono O'OdhamTonganTrinidadian and TobagonianTsimshianTurkishU.S. Virgin IslanderUgandanUkrainianUruguayanUteVenezuelanVietnameseWelshWest IndianYakamaYaquiYugoslavianYumanYup'ikZimbabwean
Immigration
NonimmigrantsImmigrantsAfghanistanAfricaAlbaniaArgentinaArmeniaAsiaAustraliaAustriaBahamasBangladeshBarbadosBelarusBelgiumBelizeBoliviaBosnia and HerzegovinaBrazilBulgariaBurma/MyanmarCabo VerdeCambodiaCameroonCanadaCaribbeanCentral AmericaChileChinaColombiaCongoCosta RicaCroatiaCubaCzechoslovakiaDenmarkDominicaDominican RepublicEastern AfricaEastern AsiaEastern EuropeEcuadorEgyptEl SalvadorEnglandEritreaEthiopiaEuropeFijiFranceGermanyGhanaGreeceGrenadaGuatemalaGuyanaHaitiHondurasHong KongHungaryIndiaIndonesiaIranIraqIrelandIsraelItalyJamaicaJapanJordanKazakhstanKenyaKoreaKuwaitLaosLatin AmericaLatviaLebanonLiberiaLithuaniaMalaysiaMexicoMicronesiaMiddle AfricaMoldovaMoroccoNepalNetherlandsNicaraguaNigeriaNorth AmericaNorth MacedoniaNorthern AfricaNorthern EuropeNorwayOceaniaPakistanPanamaPeruPhilippinesPolandPortugalRomaniaRussiaSaudi ArabiaScotlandSenegalSerbiaSierra LeoneSingaporeSomaliaSouth AfricaSouth AmericaSouth Central AsiaSouth Eastern AsiaSouthern EuropeSpainSri LankaSt. Vincent and the GrenadinesSudanSwedenSwitzerlandSyriaTaiwanThailandTrinidad and TobagoTurkeyUgandaUkraineUruguayUzbekistanVenezuelaVietnamWest IndiesWestern AfricaWestern AsiaWestern EuropeYemenZaireZimbabweAzores
Select to Compare
Race
Ancestry
AfghanAfricanAlaska NativeAlaskan AthabascanAlbanianAleutAlsatianAmericanApacheArabArapahoArgentineanArmenianAssyrian/Chaldean/SyriacAustralianAustrianBahamianBangladeshiBarbadianBasqueBelgianBelizeanBermudanBhutaneseBlackfeetBolivianBrazilianBritishBritish West IndianBulgarianBurmeseCajunCambodianCanadianCape VerdeanCarpatho RusynCelticCentral AmericanCentral American IndianCherokeeCheyenneChickasawChileanChineseChippewaChoctawColombianColvilleComancheCosta RicanCreeCreekCroatianCrowCubanCypriotCzechCzechoslovakianDanishDelawareDominicanDutchDutch West IndianEastern EuropeanEcuadorianEgyptianEnglishEstonianEthiopianEuropeanFijianFilipinoFinnishFrenchFrench American IndianFrench CanadianGermanGerman RussianGhanaianGreekGuamanian/ChamorroGuatemalanGuyaneseHaitianHmongHonduranHopiHungarianIcelanderIndian (Asian)IndonesianInupiatIranianIraqiIrishIroquoisIsraeliItalianJamaicanJapaneseJordanianKenyanKiowaKoreanLaotianLatvianLebaneseLiberianLithuanianLumbeeLuxembourgerMacedonianMalaysianMalteseMarshalleseMenomineeMexicanMexican American IndianMongolianMoroccanNative HawaiianNavajoNepaleseNew ZealanderNicaraguanNigerianNorthern EuropeanNorwegianOkinawanOsageOttawaPaiutePakistaniPalestinianPanamanianParaguayanPennsylvania GermanPeruvianPimaPolishPortuguesePotawatomiPuebloPuerto RicanPuget Sound SalishRomanianRussianSalvadoranSamoanScandinavianScotch-IrishScottishSeminoleSenegaleseSerbianShoshoneSierra LeoneanSiouxSlavicSlovakSloveneSomaliSouth AfricanSouth AmericanSouth American IndianSoviet UnionSpaniardSpanishSpanish AmericanSpanish American IndianSri LankanSubsaharan AfricanSudaneseSwedishSwissSyrianTaiwaneseThaiTlingit-HaidaTohono O'OdhamTonganTrinidadian and TobagonianTsimshianTurkishU.S. Virgin IslanderUgandanUkrainianUruguayanUteVenezuelanVietnameseWelshWest IndianYakamaYaquiYugoslavianYumanYup'ikZimbabwean
Immigration
NonimmigrantsImmigrantsAfghanistanAfricaAlbaniaArgentinaArmeniaAsiaAustraliaAustriaBahamasBangladeshBarbadosBelarusBelgiumBelizeBoliviaBosnia and HerzegovinaBrazilBulgariaBurma/MyanmarCabo VerdeCambodiaCameroonCanadaCaribbeanCentral AmericaChileChinaColombiaCongoCosta RicaCroatiaCubaCzechoslovakiaDenmarkDominicaDominican RepublicEastern AfricaEastern AsiaEastern EuropeEcuadorEgyptEl SalvadorEnglandEritreaEthiopiaEuropeFijiFranceGermanyGhanaGreeceGrenadaGuatemalaGuyanaHaitiHondurasHong KongHungaryIndiaIndonesiaIranIraqIrelandIsraelItalyJamaicaJapanJordanKazakhstanKenyaKoreaKuwaitLaosLatin AmericaLatviaLebanonLiberiaLithuaniaMalaysiaMexicoMicronesiaMiddle AfricaMoldovaMoroccoNepalNetherlandsNicaraguaNigeriaNorth AmericaNorth MacedoniaNorthern AfricaNorthern EuropeNorwayOceaniaPakistanPanamaPeruPhilippinesPolandPortugalRomaniaRussiaSaudi ArabiaScotlandSenegalSerbiaSierra LeoneSingaporeSomaliaSouth AfricaSouth AmericaSouth Central AsiaSouth Eastern AsiaSouthern EuropeSpainSri LankaSt. Vincent and the GrenadinesSudanSwedenSwitzerlandSyriaTaiwanThailandTrinidad and TobagoTurkeyUgandaUkraineUruguayUzbekistanVenezuelaVietnamWest IndiesWestern AfricaWestern AsiaWestern EuropeYemenZaireZimbabweAzores
Married-Couple Family Poverty
Income
Poverty
Unemployment
Labor Participation
Family Structure
Vehicle Availability
Education Level
Disability

Houma Married-Couple Family Poverty
Tragic

6.4%
POVERTY | MARRIED-COUPLE FAMILIES
0.0/ 100
METRIC RATING
279th/ 347
METRIC RANK

Houma Married-Couple Family Poverty Correlation Chart

The statistical analysis conducted on geographies consisting of 36,736,486 people shows a significant positive correlation between the proportion of Houma and poverty level among married-couple families in the United States with a correlation coefficient (R) of 0.636 and weighted average of 6.4%. On average, for every 1% (one percent) increase in Houma within a typical geography, there is an increase of 1.3% in poverty level among married-couple families.
Houma Married-Couple Family Poverty
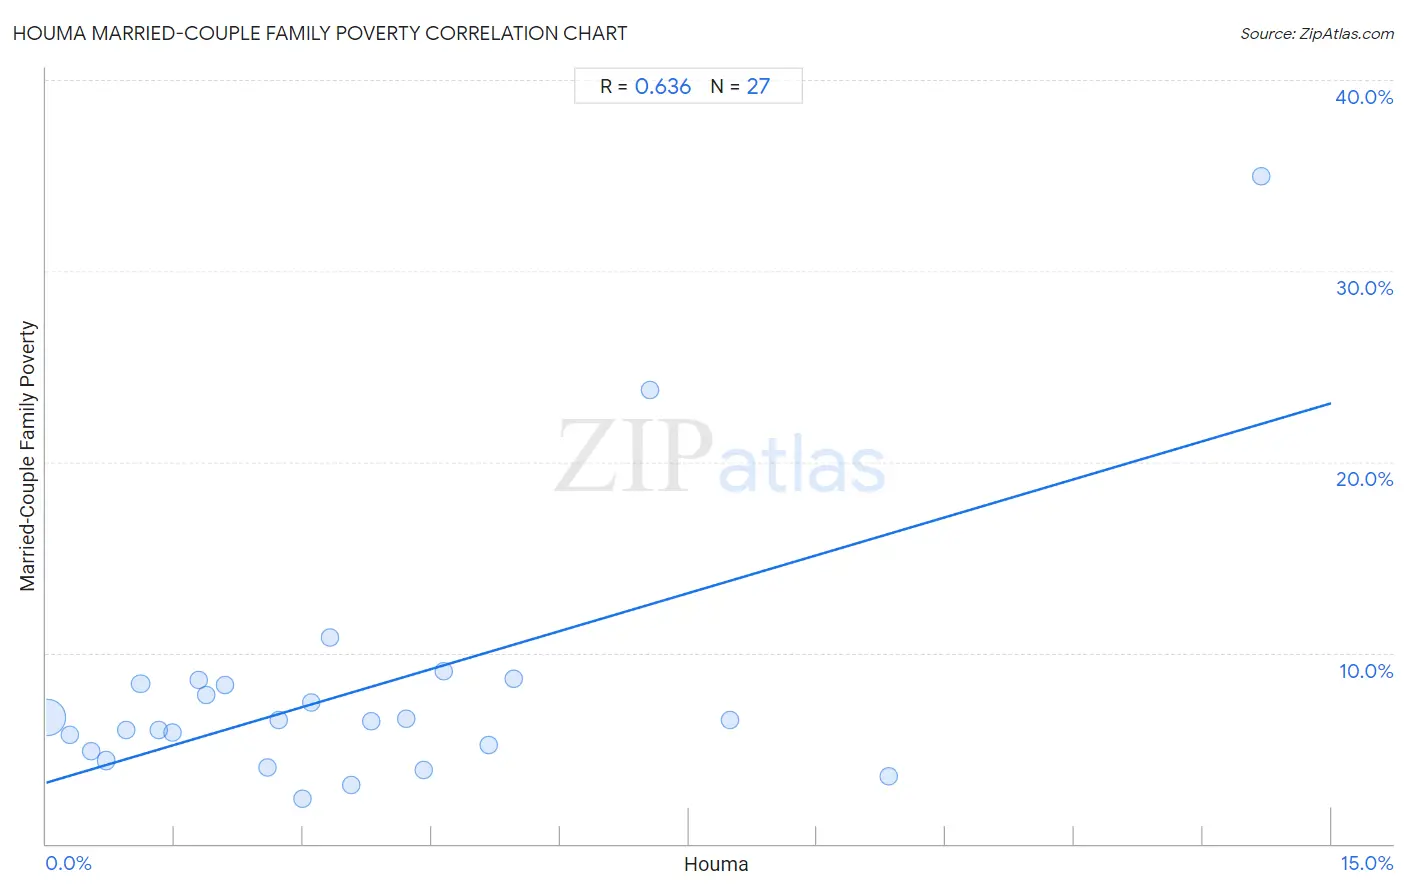
It is essential to understand that the correlation between the percentage of Houma and poverty level among married-couple families does not imply a direct cause-and-effect relationship. It remains uncertain whether the presence of Houma influences an upward or downward trend in the level of poverty level among married-couple families within an area, or if Houma simply ended up residing in those areas with higher or lower levels of poverty level among married-couple families due to other factors.

Demographics Similar to Houma by Married-Couple Family Poverty

In terms of married-couple family poverty, the demographic groups most similar to Houma are West Indian (6.4%, a difference of 0.050%), Immigrants from Trinidad and Tobago (6.4%, a difference of 0.25%), Mexican American Indian (6.4%, a difference of 0.56%), Seminole (6.4%, a difference of 0.56%), and Indonesian (6.3%, a difference of 0.73%).
DemographicsRating | RankMarried-Couple Family Poverty
Trinidadians and Tobagonians
0.1
/100
|
#272
Tragic
6.2%
Colville
0.1
/100
|
#273
Tragic
6.3%
Barbadians
0.1
/100
|
#274
Tragic
6.3%
Choctaw
0.1
/100
|
#275
Tragic
6.3%
Yaqui
0.1
/100
|
#276
Tragic
6.3%
Indonesians
0.1
/100
|
#277
Tragic
6.3%
Immigrants from Trinidad and Tobago
0.1
/100
|
#278
Tragic
6.4%
Houma
0.0
/100
|
#279
Tragic
6.4%
West Indians
0.0
/100
|
#280
Tragic
6.4%
Mexican American Indians
0.0
/100
|
#281
Tragic
6.4%
Seminole
0.0
/100
|
#282
Tragic
6.4%
Ute
0.0
/100
|
#283
Tragic
6.4%
Dutch West Indians
0.0
/100
|
#284
Tragic
6.4%
Blacks/African Americans
0.0
/100
|
#285
Tragic
6.5%
Guyanese
0.0
/100
|
#286
Tragic
6.5%

Houma Married-Couple Family Poverty Correlation Summary

MeasurementHouma DataMarried-Couple Family Poverty Data
Minimum0.012%2.3%
Maximum14.2%34.9%
Range14.2%32.6%
Mean3.6%8.0%
Median3.0%6.5%
Interquartile 25% (IQ1)1.3%4.8%
Interquartile 75% (IQ3)4.6%8.4%
Interquartile Range (IQR)3.3%3.5%
Standard Deviation (Sample)3.2%6.7%
Standard Deviation (Population)3.1%6.5%

Correlation Details

Houma PercentileSample SizeMarried-Couple Family Poverty
[
0.0%
-
0.5%
]
0.012%
35,227,9476.6%
[
0.0%
-
0.5%
]
0.27%
562,0045.7%
[
0.5%
-
1.0%
]
0.52%
300,6734.8%
[
0.5%
-
1.0%
]
0.71%
261,2104.4%
[
0.5%
-
1.0%
]
0.93%
85,9496.0%
[
1.0%
-
1.5%
]
1.10%
41,7578.4%
[
1.0%
-
1.5%
]
1.32%
4,2445.9%
[
1.0%
-
1.5%
]
1.48%
23,4195.9%
[
1.5%
-
2.0%
]
1.77%
11,8968.5%
[
1.5%
-
2.0%
]
1.87%
9,2407.8%
[
2.0%
-
2.5%
]
2.09%
8,6008.3%
[
2.5%
-
3.0%
]
2.58%
9,2874.0%
[
2.5%
-
3.0%
]
2.71%
7,9616.5%
[
2.5%
-
3.0%
]
3.00%
26,7882.3%
[
3.0%
-
3.5%
]
3.09%
5,1187.4%
[
3.0%
-
3.5%
]
3.31%
5,61910.8%
[
3.5%
-
4.0%
]
3.56%
33,0943.1%
[
3.5%
-
4.0%
]
3.79%
15,3736.4%
[
4.0%
-
4.5%
]
4.21%
11,6246.5%
[
4.0%
-
4.5%
]
4.40%
2,3863.9%
[
4.5%
-
5.0%
]
4.63%
30,1929.1%
[
5.0%
-
5.5%
]
5.16%
35,7605.2%
[
5.0%
-
5.5%
]
5.46%
5,8458.7%
[
7.0%
-
7.5%
]
7.04%
3,76223.8%
[
7.5%
-
8.0%
]
7.99%
2,8806.5%
[
9.5%
-
10.0%
]
9.84%
2,5113.6%
[
14.0%
-
14.5%
]
14.18%
1,34734.9%