Ugandan 2 or more Vehicles in Household
COMPARE
Ugandan
Select to Compare
2 or more Vehicles in Household
Ugandan 2 or more Vehicles in Household
53.5%
2+ VEHICLES AVAILABLE
3.2/ 100
METRIC RATING
233rd/ 347
METRIC RANK
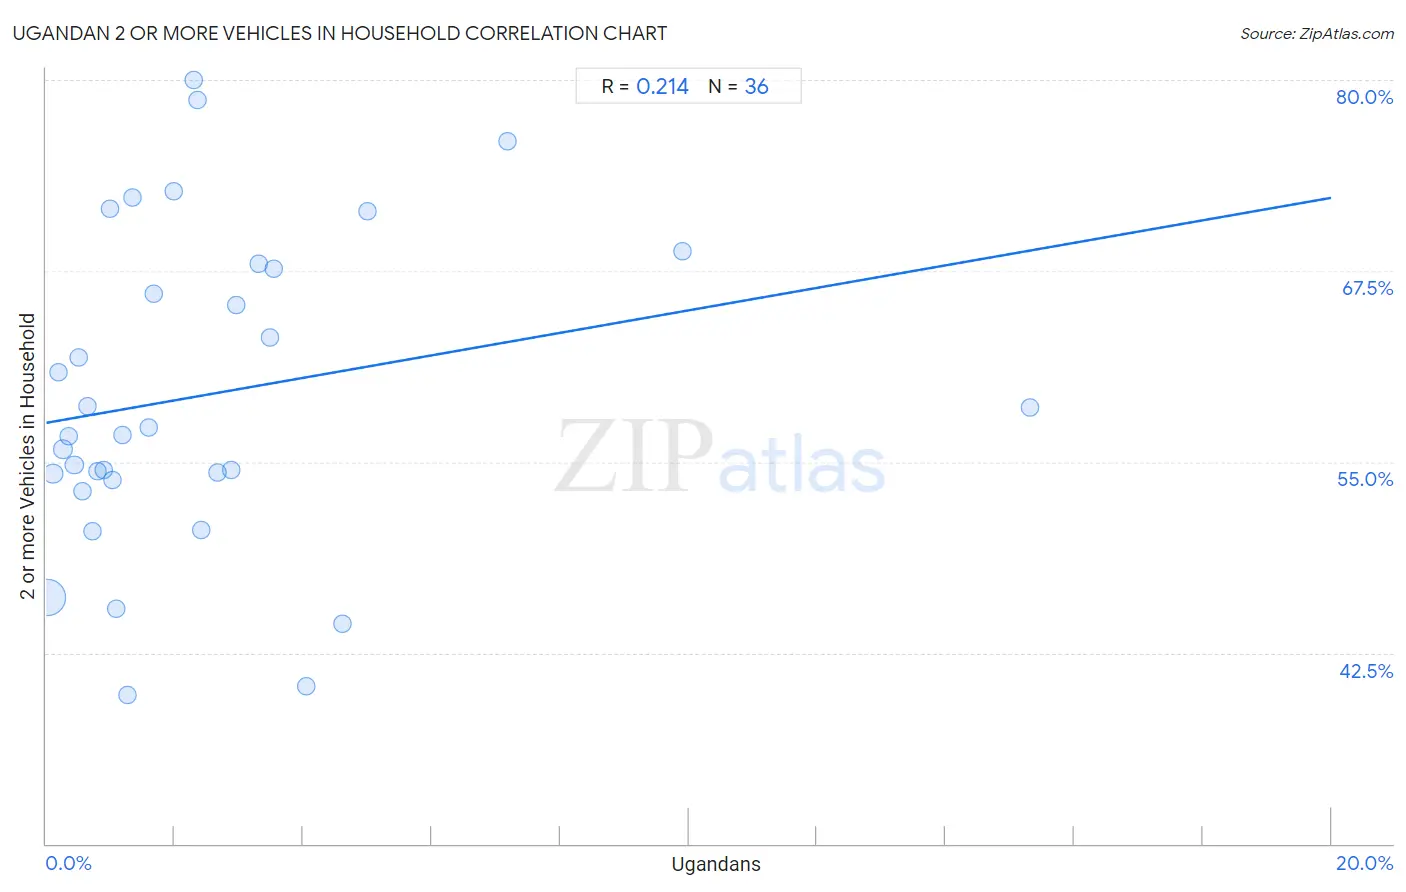
Ugandan 2 or more Vehicles in Household Correlation Chart
The statistical analysis conducted on geographies consisting of 93,998,632 people shows a weak positive correlation between the proportion of Ugandans and percentage of households with 2 or more vehicles available in the United States with a correlation coefficient (R) of 0.214 and weighted average of 53.5%. On average, for every 1% (one percent) increase in Ugandans within a typical geography, there is an increase of 0.74% in percentage of households with 2 or more vehicles available.
It is essential to understand that the correlation between the percentage of Ugandans and percentage of households with 2 or more vehicles available does not imply a direct cause-and-effect relationship. It remains uncertain whether the presence of Ugandans influences an upward or downward trend in the level of percentage of households with 2 or more vehicles available within an area, or if Ugandans simply ended up residing in those areas with higher or lower levels of percentage of households with 2 or more vehicles available due to other factors.
Demographics Similar to Ugandans by 2 or more Vehicles in Household
In terms of 2 or more vehicles in household, the demographic groups most similar to Ugandans are Immigrants from Guatemala (53.5%, a difference of 0.010%), Immigrants from Switzerland (53.4%, a difference of 0.060%), Panamanian (53.5%, a difference of 0.080%), Immigrants from Middle Africa (53.4%, a difference of 0.090%), and Immigrants from Nepal (53.5%, a difference of 0.13%).
| Demographics | Rating | Rank | 2 or more Vehicles in Household |
| Immigrants from Eastern Africa | 5.1 /100 | #226 | Tragic 53.7% |
| Sudanese | 4.1 /100 | #227 | Tragic 53.6% |
| Alaska Natives | 3.9 /100 | #228 | Tragic 53.6% |
| Immigrants from Turkey | 3.8 /100 | #229 | Tragic 53.6% |
| Immigrants from Nepal | 3.6 /100 | #230 | Tragic 53.5% |
| Panamanians | 3.4 /100 | #231 | Tragic 53.5% |
| Immigrants from Guatemala | 3.2 /100 | #232 | Tragic 53.5% |
| Ugandans | 3.2 /100 | #233 | Tragic 53.5% |
| Immigrants from Switzerland | 3.0 /100 | #234 | Tragic 53.4% |
| Immigrants from Middle Africa | 3.0 /100 | #235 | Tragic 53.4% |
| Indonesians | 2.7 /100 | #236 | Tragic 53.4% |
| Macedonians | 2.4 /100 | #237 | Tragic 53.3% |
| Immigrants from Armenia | 2.3 /100 | #238 | Tragic 53.3% |
| Cambodians | 2.3 /100 | #239 | Tragic 53.3% |
| Immigrants from Europe | 2.1 /100 | #240 | Tragic 53.2% |
Ugandan 2 or more Vehicles in Household Correlation Summary
| Measurement | Ugandan Data | 2 or more Vehicles in Household Data |
| Minimum | 0.016% | 39.7% |
| Maximum | 15.3% | 80.0% |
| Range | 15.3% | 40.3% |
| Mean | 2.5% | 59.4% |
| Median | 1.5% | 57.0% |
| Interquartile 25% (IQ1) | 0.68% | 54.0% |
| Interquartile 75% (IQ3) | 3.1% | 67.8% |
| Interquartile Range (IQR) | 2.4% | 13.8% |
| Standard Deviation (Sample) | 3.0% | 10.4% |
| Standard Deviation (Population) | 3.0% | 10.3% |
Correlation Details
| Ugandan Percentile | Sample Size | 2 or more Vehicles in Household |
[ 0.0% - 0.5% ] 0.016% | 81,497,523 | 46.1% |
[ 0.0% - 0.5% ] 0.10% | 6,235,645 | 54.2% |
[ 0.0% - 0.5% ] 0.19% | 2,313,261 | 60.9% |
[ 0.0% - 0.5% ] 0.26% | 1,400,880 | 55.8% |
[ 0.0% - 0.5% ] 0.35% | 576,211 | 56.7% |
[ 0.0% - 0.5% ] 0.44% | 562,254 | 54.8% |
[ 0.0% - 0.5% ] 0.50% | 258,146 | 61.8% |
[ 0.5% - 1.0% ] 0.57% | 194,870 | 53.0% |
[ 0.5% - 1.0% ] 0.64% | 253,519 | 58.7% |
[ 0.5% - 1.0% ] 0.72% | 114,417 | 50.5% |
[ 0.5% - 1.0% ] 0.79% | 110,900 | 54.4% |
[ 0.5% - 1.0% ] 0.90% | 39,941 | 54.4% |
[ 0.5% - 1.0% ] 0.98% | 27,519 | 71.6% |
[ 1.0% - 1.5% ] 1.03% | 18,170 | 53.8% |
[ 1.0% - 1.5% ] 1.10% | 163,767 | 45.4% |
[ 1.0% - 1.5% ] 1.19% | 44,208 | 56.7% |
[ 1.0% - 1.5% ] 1.26% | 13,516 | 39.7% |
[ 1.0% - 1.5% ] 1.34% | 49,074 | 72.3% |
[ 1.5% - 2.0% ] 1.60% | 5,682 | 57.3% |
[ 1.5% - 2.0% ] 1.68% | 238 | 66.0% |
[ 1.5% - 2.0% ] 1.99% | 604 | 72.7% |
[ 2.0% - 2.5% ] 2.29% | 1,049 | 80.0% |
[ 2.0% - 2.5% ] 2.36% | 14,202 | 78.7% |
[ 2.0% - 2.5% ] 2.42% | 9,019 | 50.5% |
[ 2.5% - 3.0% ] 2.67% | 1,010 | 54.3% |
[ 2.5% - 3.0% ] 2.87% | 16,145 | 54.5% |
[ 2.5% - 3.0% ] 2.96% | 34,536 | 65.3% |
[ 3.0% - 3.5% ] 3.30% | 6,426 | 68.0% |
[ 3.0% - 3.5% ] 3.47% | 2,274 | 63.1% |
[ 3.5% - 4.0% ] 3.55% | 507 | 67.6% |
[ 4.0% - 4.5% ] 4.05% | 1,210 | 40.3% |
[ 4.5% - 5.0% ] 4.61% | 26,684 | 44.4% |
[ 5.0% - 5.5% ] 5.00% | 180 | 71.4% |
[ 7.0% - 7.5% ] 7.17% | 2,900 | 76.0% |
[ 9.5% - 10.0% ] 9.90% | 1,303 | 68.8% |
[ 15.0% - 15.5% ] 15.32% | 842 | 58.6% |