Ugandan vs Immigrants from Liberia Self-Care Disability

COMPARE

Ugandan
Race
Ancestry
AfghanAfricanAlaska NativeAlaskan AthabascanAlbanianAleutAlsatianAmericanApacheArabArapahoArgentineanArmenianAssyrian/Chaldean/SyriacAustralianAustrianBahamianBangladeshiBarbadianBasqueBelgianBelizeanBermudanBhutaneseBlackfeetBolivianBrazilianBritishBritish West IndianBulgarianBurmeseCajunCambodianCanadianCape VerdeanCarpatho RusynCelticCentral AmericanCentral American IndianCherokeeCheyenneChickasawChileanChineseChippewaChoctawColombianColvilleComancheCosta RicanCreeCreekCroatianCrowCubanCypriotCzechCzechoslovakianDanishDelawareDominicanDutchDutch West IndianEastern EuropeanEcuadorianEgyptianEnglishEstonianEthiopianEuropeanFijianFilipinoFinnishFrenchFrench American IndianFrench CanadianGermanGerman RussianGhanaianGreekGuamanian/ChamorroGuatemalanGuyaneseHaitianHmongHonduranHopiHoumaHungarianIcelanderIndian (Asian)IndonesianInupiatIranianIraqiIrishIroquoisIsraeliItalianJamaicanJapaneseJordanianKenyanKiowaKoreanLaotianLatvianLebaneseLiberianLithuanianLumbeeLuxembourgerMacedonianMalaysianMalteseMarshalleseMenomineeMexicanMexican American IndianMongolianMoroccanNative HawaiianNavajoNepaleseNew ZealanderNicaraguanNigerianNorthern EuropeanNorwegianOkinawanOsageOttawaPaiutePakistaniPalestinianPanamanianParaguayanPennsylvania GermanPeruvianPimaPolishPortuguesePotawatomiPuebloPuerto RicanPuget Sound SalishRomanianRussianSalvadoranSamoanScandinavianScotch-IrishScottishSeminoleSenegaleseSerbianShoshoneSierra LeoneanSiouxSlavicSlovakSloveneSomaliSouth AfricanSouth AmericanSouth American IndianSoviet UnionSpaniardSpanishSpanish AmericanSpanish American IndianSri LankanSubsaharan AfricanSudaneseSwedishSwissSyrianTaiwaneseThaiTlingit-HaidaTohono O'OdhamTonganTrinidadian and TobagonianTsimshianTurkishU.S. Virgin IslanderUgandanUkrainianUruguayanUteVenezuelanVietnameseWelshWest IndianYakamaYaquiYugoslavianYumanYup'ikZimbabwean
Immigration
NonimmigrantsImmigrantsAfghanistanAfricaAlbaniaArgentinaArmeniaAsiaAustraliaAustriaBahamasBangladeshBarbadosBelarusBelgiumBelizeBoliviaBosnia and HerzegovinaBrazilBulgariaBurma/MyanmarCabo VerdeCambodiaCameroonCanadaCaribbeanCentral AmericaChileChinaColombiaCongoCosta RicaCroatiaCubaCzechoslovakiaDenmarkDominicaDominican RepublicEastern AfricaEastern AsiaEastern EuropeEcuadorEgyptEl SalvadorEnglandEritreaEthiopiaEuropeFijiFranceGermanyGhanaGreeceGrenadaGuatemalaGuyanaHaitiHondurasHong KongHungaryIndiaIndonesiaIranIraqIrelandIsraelItalyJamaicaJapanJordanKazakhstanKenyaKoreaKuwaitLaosLatin AmericaLatviaLebanonLithuaniaMalaysiaMexicoMicronesiaMiddle AfricaMoldovaMoroccoNepalNetherlandsNicaraguaNigeriaNorth AmericaNorth MacedoniaNorthern AfricaNorthern EuropeNorwayOceaniaPakistanPanamaPeruPhilippinesPolandPortugalRomaniaRussiaSaudi ArabiaScotlandSenegalSerbiaSierra LeoneSingaporeSomaliaSouth AfricaSouth AmericaSouth Central AsiaSouth Eastern AsiaSouthern EuropeSpainSri LankaSt. Vincent and the GrenadinesSudanSwedenSwitzerlandSyriaTaiwanThailandTrinidad and TobagoTurkeyUgandaUkraineUruguayUzbekistanVenezuelaVietnamWest IndiesWestern AfricaWestern AsiaWestern EuropeYemenZaireZimbabweAzores
Immigrants from Liberia
Race
Ancestry
AfghanAfricanAlaska NativeAlaskan AthabascanAlbanianAleutAlsatianAmericanApacheArabArapahoArgentineanArmenianAssyrian/Chaldean/SyriacAustralianAustrianBahamianBangladeshiBarbadianBasqueBelgianBelizeanBermudanBhutaneseBlackfeetBolivianBrazilianBritishBritish West IndianBulgarianBurmeseCajunCambodianCanadianCape VerdeanCarpatho RusynCelticCentral AmericanCentral American IndianCherokeeCheyenneChickasawChileanChineseChippewaChoctawColombianColvilleComancheCosta RicanCreeCreekCroatianCrowCubanCypriotCzechCzechoslovakianDanishDelawareDominicanDutchDutch West IndianEastern EuropeanEcuadorianEgyptianEnglishEstonianEthiopianEuropeanFijianFilipinoFinnishFrenchFrench American IndianFrench CanadianGermanGerman RussianGhanaianGreekGuamanian/ChamorroGuatemalanGuyaneseHaitianHmongHonduranHopiHoumaHungarianIcelanderIndian (Asian)IndonesianInupiatIranianIraqiIrishIroquoisIsraeliItalianJamaicanJapaneseJordanianKenyanKiowaKoreanLaotianLatvianLebaneseLiberianLithuanianLumbeeLuxembourgerMacedonianMalaysianMalteseMarshalleseMenomineeMexicanMexican American IndianMongolianMoroccanNative HawaiianNavajoNepaleseNew ZealanderNicaraguanNigerianNorthern EuropeanNorwegianOkinawanOsageOttawaPaiutePakistaniPalestinianPanamanianParaguayanPennsylvania GermanPeruvianPimaPolishPortuguesePotawatomiPuebloPuerto RicanPuget Sound SalishRomanianRussianSalvadoranSamoanScandinavianScotch-IrishScottishSeminoleSenegaleseSerbianShoshoneSierra LeoneanSiouxSlavicSlovakSloveneSomaliSouth AfricanSouth AmericanSouth American IndianSoviet UnionSpaniardSpanishSpanish AmericanSpanish American IndianSri LankanSubsaharan AfricanSudaneseSwedishSwissSyrianTaiwaneseThaiTlingit-HaidaTohono O'OdhamTonganTrinidadian and TobagonianTsimshianTurkishU.S. Virgin IslanderUkrainianUruguayanUteVenezuelanVietnameseWelshWest IndianYakamaYaquiYugoslavianYumanYup'ikZimbabwean
Immigration
NonimmigrantsImmigrantsAfghanistanAfricaAlbaniaArgentinaArmeniaAsiaAustraliaAustriaBahamasBangladeshBarbadosBelarusBelgiumBelizeBoliviaBosnia and HerzegovinaBrazilBulgariaBurma/MyanmarCabo VerdeCambodiaCameroonCanadaCaribbeanCentral AmericaChileChinaColombiaCongoCosta RicaCroatiaCubaCzechoslovakiaDenmarkDominicaDominican RepublicEastern AfricaEastern AsiaEastern EuropeEcuadorEgyptEl SalvadorEnglandEritreaEthiopiaEuropeFijiFranceGermanyGhanaGreeceGrenadaGuatemalaGuyanaHaitiHondurasHong KongHungaryIndiaIndonesiaIranIraqIrelandIsraelItalyJamaicaJapanJordanKazakhstanKenyaKoreaKuwaitLaosLatin AmericaLatviaLebanonLiberiaLithuaniaMalaysiaMexicoMicronesiaMiddle AfricaMoldovaMoroccoNepalNetherlandsNicaraguaNigeriaNorth AmericaNorth MacedoniaNorthern AfricaNorthern EuropeNorwayOceaniaPakistanPanamaPeruPhilippinesPolandPortugalRomaniaRussiaSaudi ArabiaScotlandSenegalSerbiaSierra LeoneSingaporeSomaliaSouth AfricaSouth AmericaSouth Central AsiaSouth Eastern AsiaSouthern EuropeSpainSri LankaSt. Vincent and the GrenadinesSudanSwedenSwitzerlandSyriaTaiwanThailandTrinidad and TobagoTurkeyUgandaUkraineUruguayUzbekistanVenezuelaVietnamWest IndiesWestern AfricaWestern AsiaWestern EuropeYemenZaireZimbabweAzores
Self-Care Disability
Income
Poverty
Unemployment
Labor Participation
Family Structure
Vehicle Availability
Education Level
Disability

Self-Care Disability Comparison

Ugandans

Immigrants from Liberia

Exceptional
Tragic
2.3%
SELF-CARE DISABILITY
98.8/ 100
METRIC RATING
81st/ 347
METRIC RANK
2.6%
SELF-CARE DISABILITY
0.4/ 100
METRIC RATING
251st/ 347
METRIC RANK

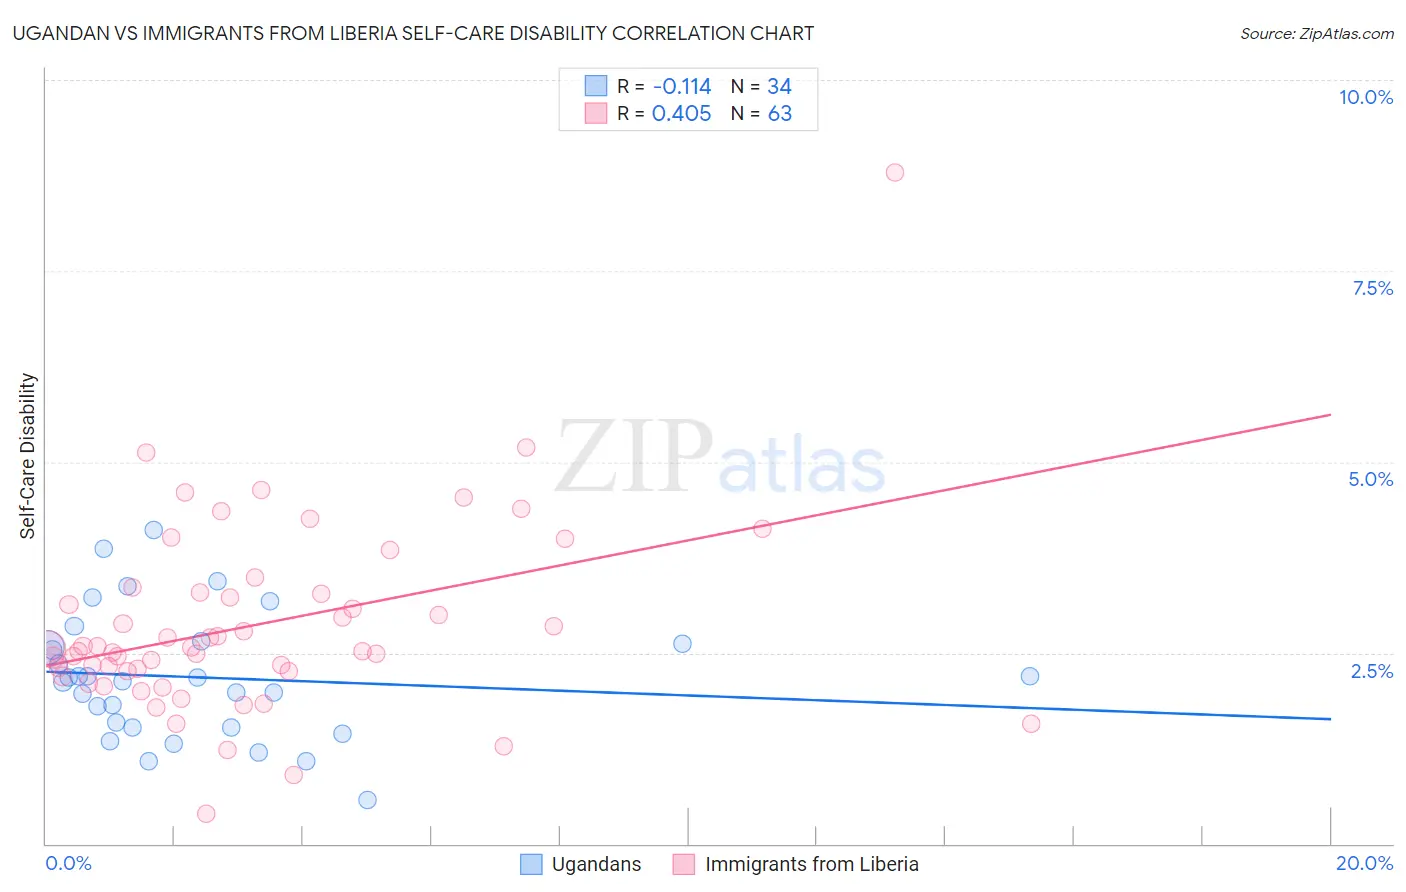
Ugandan vs Immigrants from Liberia Self-Care Disability Correlation Chart

The statistical analysis conducted on geographies consisting of 93,977,399 people shows a poor negative correlation between the proportion of Ugandans and percentage of population with self-care disability in the United States with a correlation coefficient (R) of -0.114 and weighted average of 2.3%. Similarly, the statistical analysis conducted on geographies consisting of 135,176,274 people shows a moderate positive correlation between the proportion of Immigrants from Liberia and percentage of population with self-care disability in the United States with a correlation coefficient (R) of 0.405 and weighted average of 2.6%, a difference of 12.4%.
Ugandan vs Immigrants from Liberia Self-Care Disability

Self-Care Disability Correlation Summary

MeasurementUgandanImmigrants from Liberia
Minimum0.57%0.40%
Maximum4.1%8.8%
Range3.5%8.4%
Mean2.2%2.9%
Median2.2%2.6%
Interquartile 25% (IQ1)1.5%2.3%
Interquartile 75% (IQ3)2.6%3.3%
Interquartile Range (IQR)1.1%1.0%
Standard Deviation (Sample)0.82%1.3%
Standard Deviation (Population)0.81%1.2%

Similar Demographics by Self-Care Disability

Demographics Similar to Ugandans by Self-Care Disability

In terms of self-care disability, the demographic groups most similar to Ugandans are Immigrants from Denmark (2.3%, a difference of 0.0%), Chilean (2.3%, a difference of 0.070%), Indian (Asian) (2.3%, a difference of 0.070%), Immigrants from Spain (2.3%, a difference of 0.11%), and Immigrants from Middle Africa (2.3%, a difference of 0.26%).
DemographicsRating | RankSelf-Care Disability
Immigrants | Switzerland
99.1
/100
|
#74
Exceptional
2.3%
Immigrants | Netherlands
99.1
/100
|
#75
Exceptional
2.3%
Immigrants | China
99.1
/100
|
#76
Exceptional
2.3%
Immigrants | Middle Africa
99.0
/100
|
#77
Exceptional
2.3%
Immigrants | Ireland
99.0
/100
|
#78
Exceptional
2.3%
Immigrants | Kenya
99.0
/100
|
#79
Exceptional
2.3%
Chileans
98.8
/100
|
#80
Exceptional
2.3%
Ugandans
98.8
/100
|
#81
Exceptional
2.3%
Immigrants | Denmark
98.8
/100
|
#82
Exceptional
2.3%
Indians (Asian)
98.7
/100
|
#83
Exceptional
2.3%
Immigrants | Spain
98.7
/100
|
#84
Exceptional
2.3%
Estonians
98.3
/100
|
#85
Exceptional
2.3%
Immigrants | Northern Africa
98.2
/100
|
#86
Exceptional
2.3%
Sierra Leoneans
98.0
/100
|
#87
Exceptional
2.4%
Lithuanians
98.0
/100
|
#88
Exceptional
2.4%

Demographics Similar to Immigrants from Liberia by Self-Care Disability

In terms of self-care disability, the demographic groups most similar to Immigrants from Liberia are Immigrants from Bangladesh (2.6%, a difference of 0.070%), Portuguese (2.6%, a difference of 0.080%), Immigrants from Haiti (2.6%, a difference of 0.15%), Mexican American Indian (2.6%, a difference of 0.16%), and Haitian (2.6%, a difference of 0.17%).
DemographicsRating | RankSelf-Care Disability
Yuman
0.8
/100
|
#244
Tragic
2.6%
Immigrants | Western Asia
0.6
/100
|
#245
Tragic
2.6%
Cheyenne
0.6
/100
|
#246
Tragic
2.6%
Immigrants | Albania
0.6
/100
|
#247
Tragic
2.6%
Nicaraguans
0.6
/100
|
#248
Tragic
2.6%
Mexican American Indians
0.5
/100
|
#249
Tragic
2.6%
Portuguese
0.4
/100
|
#250
Tragic
2.6%
Immigrants | Liberia
0.4
/100
|
#251
Tragic
2.6%
Immigrants | Bangladesh
0.4
/100
|
#252
Tragic
2.6%
Immigrants | Haiti
0.3
/100
|
#253
Tragic
2.6%
Haitians
0.3
/100
|
#254
Tragic
2.6%
Tsimshian
0.3
/100
|
#255
Tragic
2.6%
Immigrants | Central America
0.3
/100
|
#256
Tragic
2.6%
Potawatomi
0.3
/100
|
#257
Tragic
2.6%
Immigrants | Nonimmigrants
0.3
/100
|
#258
Tragic
2.6%