Ugandan College, 1 year or more

COMPARE

Ugandan
Race
Ancestry
AfghanAfricanAlaska NativeAlaskan AthabascanAlbanianAleutAlsatianAmericanApacheArabArapahoArgentineanArmenianAssyrian/Chaldean/SyriacAustralianAustrianBahamianBangladeshiBarbadianBasqueBelgianBelizeanBermudanBhutaneseBlackfeetBolivianBrazilianBritishBritish West IndianBulgarianBurmeseCajunCambodianCanadianCape VerdeanCarpatho RusynCelticCentral AmericanCentral American IndianCherokeeCheyenneChickasawChileanChineseChippewaChoctawColombianColvilleComancheCosta RicanCreeCreekCroatianCrowCubanCypriotCzechCzechoslovakianDanishDelawareDominicanDutchDutch West IndianEastern EuropeanEcuadorianEgyptianEnglishEstonianEthiopianEuropeanFijianFilipinoFinnishFrenchFrench American IndianFrench CanadianGermanGerman RussianGhanaianGreekGuamanian/ChamorroGuatemalanGuyaneseHaitianHmongHonduranHopiHoumaHungarianIcelanderIndian (Asian)IndonesianInupiatIranianIraqiIrishIroquoisIsraeliItalianJamaicanJapaneseJordanianKenyanKiowaKoreanLaotianLatvianLebaneseLiberianLithuanianLumbeeLuxembourgerMacedonianMalaysianMalteseMarshalleseMenomineeMexicanMexican American IndianMongolianMoroccanNative HawaiianNavajoNepaleseNew ZealanderNicaraguanNigerianNorthern EuropeanNorwegianOkinawanOsageOttawaPaiutePakistaniPalestinianPanamanianParaguayanPennsylvania GermanPeruvianPimaPolishPortuguesePotawatomiPuebloPuerto RicanPuget Sound SalishRomanianRussianSalvadoranSamoanScandinavianScotch-IrishScottishSeminoleSenegaleseSerbianShoshoneSierra LeoneanSiouxSlavicSlovakSloveneSomaliSouth AfricanSouth AmericanSouth American IndianSoviet UnionSpaniardSpanishSpanish AmericanSpanish American IndianSri LankanSubsaharan AfricanSudaneseSwedishSwissSyrianTaiwaneseThaiTlingit-HaidaTohono O'OdhamTonganTrinidadian and TobagonianTsimshianTurkishU.S. Virgin IslanderUgandanUkrainianUruguayanUteVenezuelanVietnameseWelshWest IndianYakamaYaquiYugoslavianYumanYup'ikZimbabwean
Immigration
NonimmigrantsImmigrantsAfghanistanAfricaAlbaniaArgentinaArmeniaAsiaAustraliaAustriaBahamasBangladeshBarbadosBelarusBelgiumBelizeBoliviaBosnia and HerzegovinaBrazilBulgariaBurma/MyanmarCabo VerdeCambodiaCameroonCanadaCaribbeanCentral AmericaChileChinaColombiaCongoCosta RicaCroatiaCubaCzechoslovakiaDenmarkDominicaDominican RepublicEastern AfricaEastern AsiaEastern EuropeEcuadorEgyptEl SalvadorEnglandEritreaEthiopiaEuropeFijiFranceGermanyGhanaGreeceGrenadaGuatemalaGuyanaHaitiHondurasHong KongHungaryIndiaIndonesiaIranIraqIrelandIsraelItalyJamaicaJapanJordanKazakhstanKenyaKoreaKuwaitLaosLatin AmericaLatviaLebanonLiberiaLithuaniaMalaysiaMexicoMicronesiaMiddle AfricaMoldovaMoroccoNepalNetherlandsNicaraguaNigeriaNorth AmericaNorth MacedoniaNorthern AfricaNorthern EuropeNorwayOceaniaPakistanPanamaPeruPhilippinesPolandPortugalRomaniaRussiaSaudi ArabiaScotlandSenegalSerbiaSierra LeoneSingaporeSomaliaSouth AfricaSouth AmericaSouth Central AsiaSouth Eastern AsiaSouthern EuropeSpainSri LankaSt. Vincent and the GrenadinesSudanSwedenSwitzerlandSyriaTaiwanThailandTrinidad and TobagoTurkeyUgandaUkraineUruguayUzbekistanVenezuelaVietnamWest IndiesWestern AfricaWestern AsiaWestern EuropeYemenZaireZimbabweAzores
Select to Compare
Race
Ancestry
AfghanAfricanAlaska NativeAlaskan AthabascanAlbanianAleutAlsatianAmericanApacheArabArapahoArgentineanArmenianAssyrian/Chaldean/SyriacAustralianAustrianBahamianBangladeshiBarbadianBasqueBelgianBelizeanBermudanBhutaneseBlackfeetBolivianBrazilianBritishBritish West IndianBulgarianBurmeseCajunCambodianCanadianCape VerdeanCarpatho RusynCelticCentral AmericanCentral American IndianCherokeeCheyenneChickasawChileanChineseChippewaChoctawColombianColvilleComancheCosta RicanCreeCreekCroatianCrowCubanCypriotCzechCzechoslovakianDanishDelawareDominicanDutchDutch West IndianEastern EuropeanEcuadorianEgyptianEnglishEstonianEthiopianEuropeanFijianFilipinoFinnishFrenchFrench American IndianFrench CanadianGermanGerman RussianGhanaianGreekGuamanian/ChamorroGuatemalanGuyaneseHaitianHmongHonduranHopiHoumaHungarianIcelanderIndian (Asian)IndonesianInupiatIranianIraqiIrishIroquoisIsraeliItalianJamaicanJapaneseJordanianKenyanKiowaKoreanLaotianLatvianLebaneseLiberianLithuanianLumbeeLuxembourgerMacedonianMalaysianMalteseMarshalleseMenomineeMexicanMexican American IndianMongolianMoroccanNative HawaiianNavajoNepaleseNew ZealanderNicaraguanNigerianNorthern EuropeanNorwegianOkinawanOsageOttawaPaiutePakistaniPalestinianPanamanianParaguayanPennsylvania GermanPeruvianPimaPolishPortuguesePotawatomiPuebloPuerto RicanPuget Sound SalishRomanianRussianSalvadoranSamoanScandinavianScotch-IrishScottishSeminoleSenegaleseSerbianShoshoneSierra LeoneanSiouxSlavicSlovakSloveneSomaliSouth AfricanSouth AmericanSouth American IndianSoviet UnionSpaniardSpanishSpanish AmericanSpanish American IndianSri LankanSubsaharan AfricanSudaneseSwedishSwissSyrianTaiwaneseThaiTlingit-HaidaTohono O'OdhamTonganTrinidadian and TobagonianTsimshianTurkishU.S. Virgin IslanderUkrainianUruguayanUteVenezuelanVietnameseWelshWest IndianYakamaYaquiYugoslavianYumanYup'ikZimbabwean
Immigration
NonimmigrantsImmigrantsAfghanistanAfricaAlbaniaArgentinaArmeniaAsiaAustraliaAustriaBahamasBangladeshBarbadosBelarusBelgiumBelizeBoliviaBosnia and HerzegovinaBrazilBulgariaBurma/MyanmarCabo VerdeCambodiaCameroonCanadaCaribbeanCentral AmericaChileChinaColombiaCongoCosta RicaCroatiaCubaCzechoslovakiaDenmarkDominicaDominican RepublicEastern AfricaEastern AsiaEastern EuropeEcuadorEgyptEl SalvadorEnglandEritreaEthiopiaEuropeFijiFranceGermanyGhanaGreeceGrenadaGuatemalaGuyanaHaitiHondurasHong KongHungaryIndiaIndonesiaIranIraqIrelandIsraelItalyJamaicaJapanJordanKazakhstanKenyaKoreaKuwaitLaosLatin AmericaLatviaLebanonLiberiaLithuaniaMalaysiaMexicoMicronesiaMiddle AfricaMoldovaMoroccoNepalNetherlandsNicaraguaNigeriaNorth AmericaNorth MacedoniaNorthern AfricaNorthern EuropeNorwayOceaniaPakistanPanamaPeruPhilippinesPolandPortugalRomaniaRussiaSaudi ArabiaScotlandSenegalSerbiaSierra LeoneSingaporeSomaliaSouth AfricaSouth AmericaSouth Central AsiaSouth Eastern AsiaSouthern EuropeSpainSri LankaSt. Vincent and the GrenadinesSudanSwedenSwitzerlandSyriaTaiwanThailandTrinidad and TobagoTurkeyUgandaUkraineUruguayUzbekistanVenezuelaVietnamWest IndiesWestern AfricaWestern AsiaWestern EuropeYemenZaireZimbabweAzores
College, 1 year or more
Income
Poverty
Unemployment
Labor Participation
Family Structure
Vehicle Availability
Education Level
Disability

Ugandan College, 1 year or more
Exceptional

61.2%
COLLEGE, 1 YEAR OR MORE
90.7/ 100
METRIC RATING
129th/ 347
METRIC RANK

Ugandan College, 1 year or more Correlation Chart

The statistical analysis conducted on geographies consisting of 94,018,576 people shows a weak negative correlation between the proportion of Ugandans and percentage of population with at least college, 1 year or more education in the United States with a correlation coefficient (R) of -0.273 and weighted average of 61.2%. On average, for every 1% (one percent) increase in Ugandans within a typical geography, there is a decrease of 1.0% in percentage of population with at least college, 1 year or more education.
Ugandan College, 1 year or more
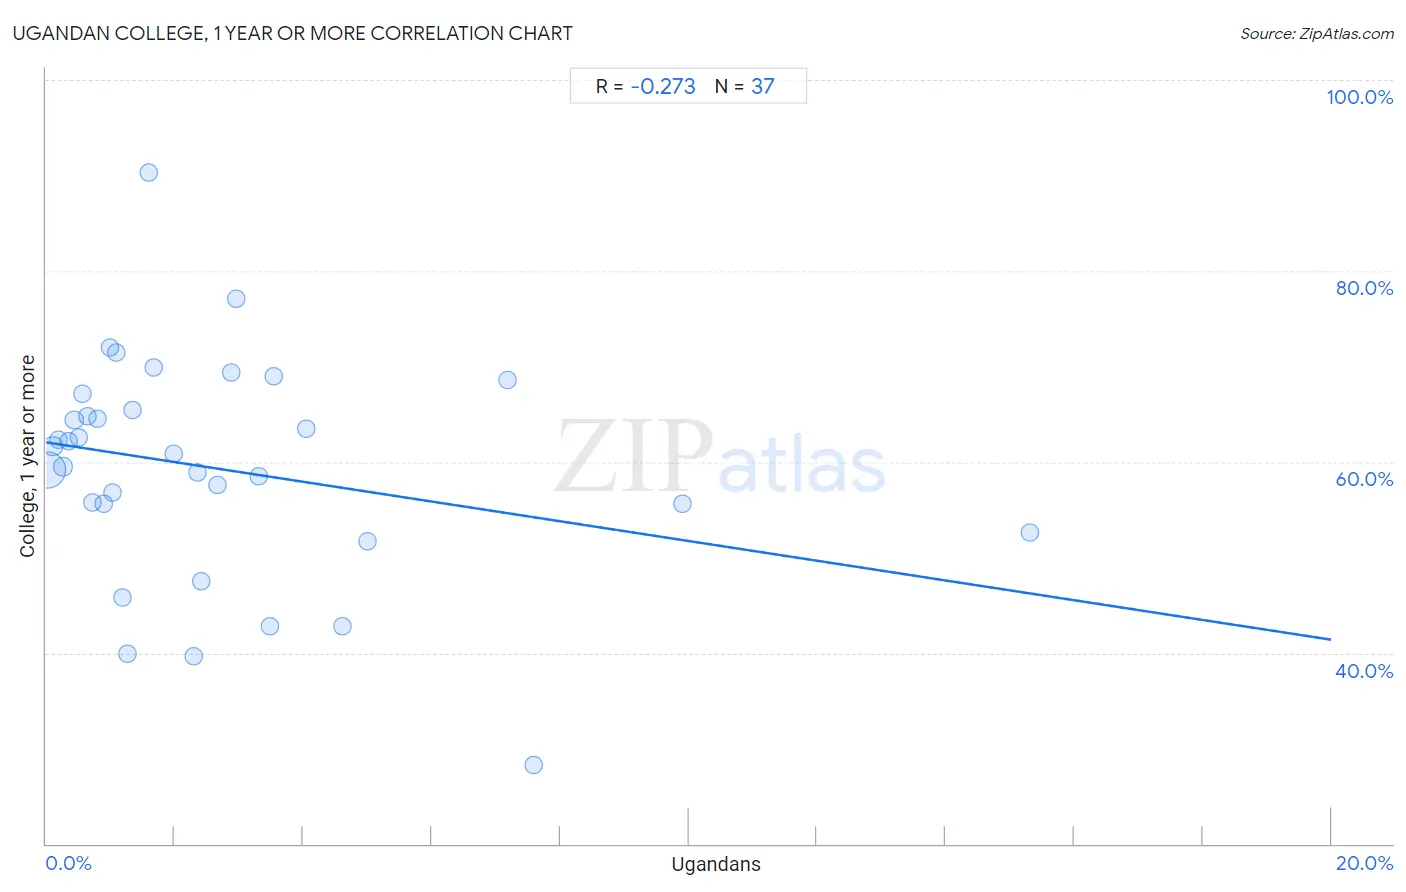
It is essential to understand that the correlation between the percentage of Ugandans and percentage of population with at least college, 1 year or more education does not imply a direct cause-and-effect relationship. It remains uncertain whether the presence of Ugandans influences an upward or downward trend in the level of percentage of population with at least college, 1 year or more education within an area, or if Ugandans simply ended up residing in those areas with higher or lower levels of percentage of population with at least college, 1 year or more education due to other factors.

Demographics Similar to Ugandans by College, 1 year or more

In terms of college, 1 year or more, the demographic groups most similar to Ugandans are Immigrants from Italy (61.2%, a difference of 0.060%), Immigrants from Eastern Africa (61.2%, a difference of 0.070%), Alsatian (61.3%, a difference of 0.090%), Immigrants from Syria (61.3%, a difference of 0.14%), and Italian (61.1%, a difference of 0.18%).
DemographicsRating | RankCollege, 1 year or more
Immigrants from Chile
92.3
/100
|
#122
Exceptional
61.4%
Serbians
92.2
/100
|
#123
Exceptional
61.4%
Venezuelans
92.1
/100
|
#124
Exceptional
61.3%
Immigrants from Syria
91.6
/100
|
#125
Exceptional
61.3%
Alsatians
91.3
/100
|
#126
Exceptional
61.3%
Immigrants from Eastern Africa
91.1
/100
|
#127
Exceptional
61.2%
Immigrants from Italy
91.1
/100
|
#128
Exceptional
61.2%
Ugandans
90.7
/100
|
#129
Exceptional
61.2%
Italians
89.5
/100
|
#130
Excellent
61.1%
Immigrants from Morocco
89.5
/100
|
#131
Excellent
61.1%
Scandinavians
88.2
/100
|
#132
Excellent
61.0%
Immigrants from Uzbekistan
88.0
/100
|
#133
Excellent
61.0%
Immigrants from Venezuela
87.9
/100
|
#134
Excellent
61.0%
Immigrants from Uganda
87.4
/100
|
#135
Excellent
60.9%
Basques
87.2
/100
|
#136
Excellent
60.9%

Ugandan College, 1 year or more Correlation Summary

MeasurementUgandan DataCollege, 1 year or more Data
Minimum0.016%28.3%
Maximum15.3%90.3%
Range15.3%62.0%
Mean2.6%59.3%
Median1.6%60.9%
Interquartile 25% (IQ1)0.68%54.1%
Interquartile 75% (IQ3)3.4%66.3%
Interquartile Range (IQR)2.7%12.2%
Standard Deviation (Sample)3.1%11.7%
Standard Deviation (Population)3.1%11.6%

Correlation Details

Ugandan PercentileSample SizeCollege, 1 year or more
[
0.0%
-
0.5%
]
0.016%
81,499,76659.2%
[
0.0%
-
0.5%
]
0.10%
6,235,64561.6%
[
0.0%
-
0.5%
]
0.19%
2,313,26162.3%
[
0.0%
-
0.5%
]
0.26%
1,403,38859.5%
[
0.0%
-
0.5%
]
0.35%
576,21162.2%
[
0.0%
-
0.5%
]
0.44%
564,43164.4%
[
0.0%
-
0.5%
]
0.50%
258,14662.5%
[
0.5%
-
1.0%
]
0.57%
194,87067.2%
[
0.5%
-
1.0%
]
0.64%
253,51964.8%
[
0.5%
-
1.0%
]
0.72%
114,41755.7%
[
0.5%
-
1.0%
]
0.80%
123,60064.6%
[
0.5%
-
1.0%
]
0.90%
39,94155.7%
[
0.5%
-
1.0%
]
0.98%
27,51971.9%
[
1.0%
-
1.5%
]
1.03%
18,17056.7%
[
1.0%
-
1.5%
]
1.10%
163,76771.4%
[
1.0%
-
1.5%
]
1.19%
44,20845.8%
[
1.0%
-
1.5%
]
1.26%
13,51639.9%
[
1.0%
-
1.5%
]
1.34%
49,07465.4%
[
1.5%
-
2.0%
]
1.60%
5,68290.3%
[
1.5%
-
2.0%
]
1.68%
23869.8%
[
1.5%
-
2.0%
]
1.99%
60460.9%
[
2.0%
-
2.5%
]
2.29%
1,04939.6%
[
2.0%
-
2.5%
]
2.36%
14,20258.9%
[
2.0%
-
2.5%
]
2.42%
9,01947.4%
[
2.5%
-
3.0%
]
2.67%
1,01057.5%
[
2.5%
-
3.0%
]
2.87%
16,14569.4%
[
2.5%
-
3.0%
]
2.96%
34,53677.0%
[
3.0%
-
3.5%
]
3.30%
6,42658.5%
[
3.0%
-
3.5%
]
3.47%
2,27442.8%
[
3.5%
-
4.0%
]
3.55%
50769.0%
[
4.0%
-
4.5%
]
4.05%
1,21063.5%
[
4.5%
-
5.0%
]
4.61%
26,68442.8%
[
5.0%
-
5.5%
]
5.00%
18051.7%
[
7.0%
-
7.5%
]
7.17%
2,90068.6%
[
7.5%
-
8.0%
]
7.59%
31628.3%
[
9.5%
-
10.0%
]
9.90%
1,30355.7%
[
15.0%
-
15.5%
]
15.32%
84252.6%