Ugandan Unemployment Among Women with Children Ages 6 to 17 years
COMPARE
Ugandan
Select to Compare
Unemployment Among Women with Children Ages 6 to 17 years
Ugandan Unemployment Among Women with Children Ages 6 to 17 years
12.0%
UNEMPLOYMENT | WOMEN W/ CHILDREN 6 TO 17
0.0/ 100
METRIC RATING
334th/ 347
METRIC RANK
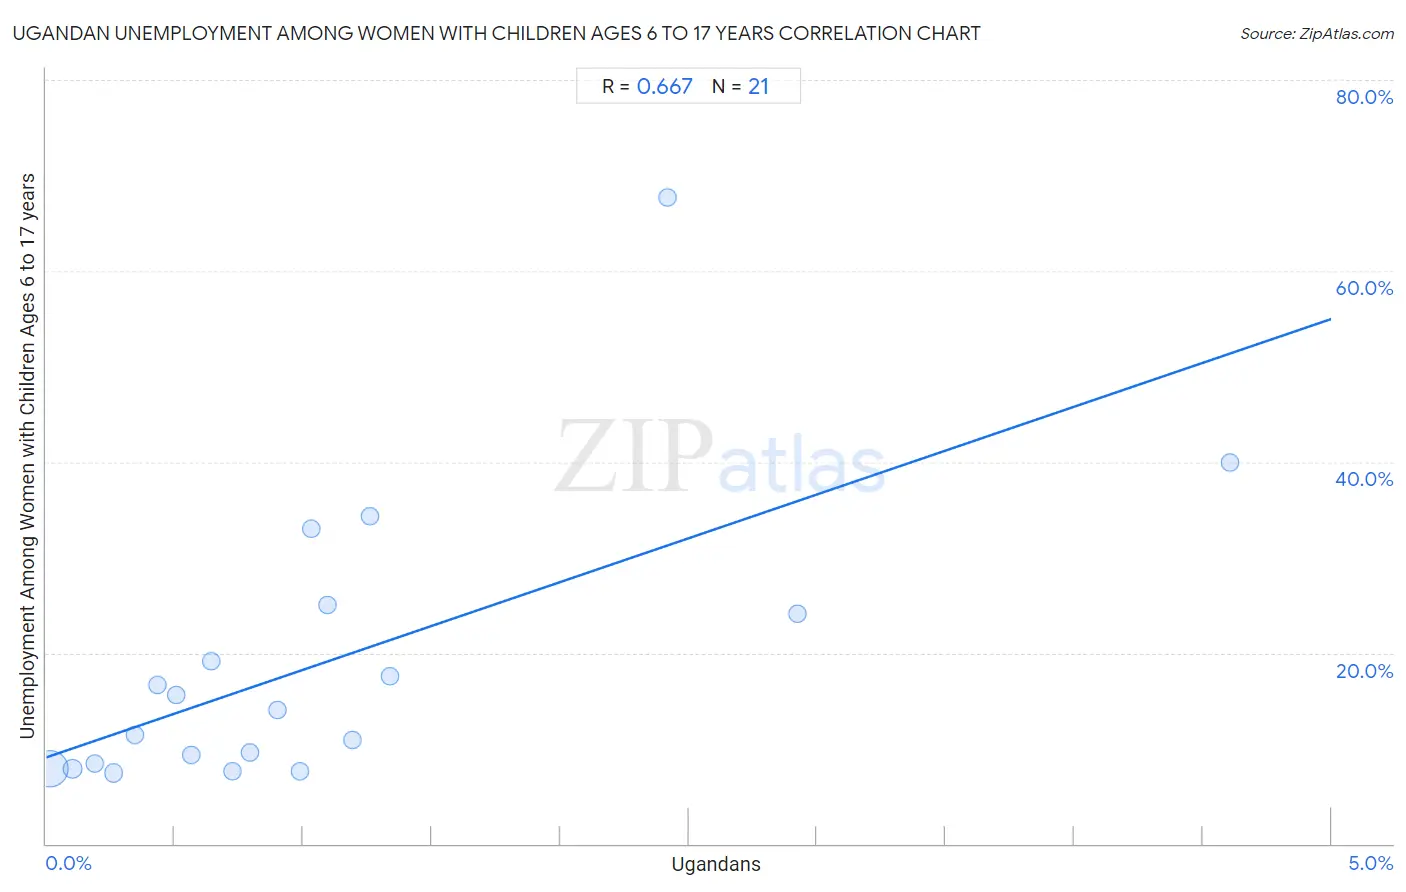
Ugandan Unemployment Among Women with Children Ages 6 to 17 years Correlation Chart
The statistical analysis conducted on geographies consisting of 84,445,978 people shows a significant positive correlation between the proportion of Ugandans and unemployment rate among women with children between the ages 6 and 17 in the United States with a correlation coefficient (R) of 0.667 and weighted average of 12.0%. On average, for every 1% (one percent) increase in Ugandans within a typical geography, there is an increase of 9.2% in unemployment rate among women with children between the ages 6 and 17.
It is essential to understand that the correlation between the percentage of Ugandans and unemployment rate among women with children between the ages 6 and 17 does not imply a direct cause-and-effect relationship. It remains uncertain whether the presence of Ugandans influences an upward or downward trend in the level of unemployment rate among women with children between the ages 6 and 17 within an area, or if Ugandans simply ended up residing in those areas with higher or lower levels of unemployment rate among women with children between the ages 6 and 17 due to other factors.
Demographics Similar to Ugandans by Unemployment Among Women with Children Ages 6 to 17 years
In terms of unemployment among women with children ages 6 to 17 years, the demographic groups most similar to Ugandans are Colville (12.3%, a difference of 2.7%), Houma (12.5%, a difference of 3.7%), Native/Alaskan (11.5%, a difference of 4.9%), Tsimshian (11.4%, a difference of 5.6%), and Black/African American (11.4%, a difference of 5.7%).
| Demographics | Rating | Rank | Unemployment Among Women with Children Ages 6 to 17 years |
| Cape Verdeans | 0.0 /100 | #327 | Tragic 10.9% |
| Ottawa | 0.0 /100 | #328 | Tragic 10.9% |
| Pennsylvania Germans | 0.0 /100 | #329 | Tragic 11.0% |
| Chippewa | 0.0 /100 | #330 | Tragic 11.1% |
| Blacks/African Americans | 0.0 /100 | #331 | Tragic 11.4% |
| Tsimshian | 0.0 /100 | #332 | Tragic 11.4% |
| Natives/Alaskans | 0.0 /100 | #333 | Tragic 11.5% |
| Ugandans | 0.0 /100 | #334 | Tragic 12.0% |
| Colville | 0.0 /100 | #335 | Tragic 12.3% |
| Houma | 0.0 /100 | #336 | Tragic 12.5% |
| Immigrants from Yemen | 0.0 /100 | #337 | Tragic 12.7% |
| Hopi | 0.0 /100 | #338 | Tragic 12.9% |
| Sioux | 0.0 /100 | #339 | Tragic 13.2% |
| Puerto Ricans | 0.0 /100 | #340 | Tragic 13.9% |
| Navajo | 0.0 /100 | #341 | Tragic 14.2% |
Ugandan Unemployment Among Women with Children Ages 6 to 17 years Correlation Summary
| Measurement | Ugandan Data | Unemployment Among Women with Children Ages 6 to 17 years Data |
| Minimum | 0.015% | 7.4% |
| Maximum | 4.6% | 67.7% |
| Range | 4.6% | 60.3% |
| Mean | 1.1% | 18.8% |
| Median | 0.79% | 14.0% |
| Interquartile 25% (IQ1) | 0.39% | 8.1% |
| Interquartile 75% (IQ3) | 1.2% | 24.6% |
| Interquartile Range (IQR) | 0.84% | 16.4% |
| Standard Deviation (Sample) | 1.1% | 14.9% |
| Standard Deviation (Population) | 1.1% | 14.5% |
Correlation Details
| Ugandan Percentile | Sample Size | Unemployment Among Women with Children Ages 6 to 17 years |
[ 0.0% - 0.5% ] 0.015% | 75,634,548 | 7.9% |
[ 0.0% - 0.5% ] 0.10% | 4,400,944 | 7.8% |
[ 0.0% - 0.5% ] 0.19% | 1,725,892 | 8.4% |
[ 0.0% - 0.5% ] 0.26% | 1,081,022 | 7.4% |
[ 0.0% - 0.5% ] 0.34% | 324,626 | 11.4% |
[ 0.0% - 0.5% ] 0.43% | 280,782 | 16.6% |
[ 0.5% - 1.0% ] 0.50% | 131,454 | 15.5% |
[ 0.5% - 1.0% ] 0.57% | 149,613 | 9.3% |
[ 0.5% - 1.0% ] 0.64% | 201,550 | 19.1% |
[ 0.5% - 1.0% ] 0.73% | 81,222 | 7.6% |
[ 0.5% - 1.0% ] 0.79% | 91,872 | 9.6% |
[ 0.5% - 1.0% ] 0.90% | 32,917 | 14.0% |
[ 0.5% - 1.0% ] 0.99% | 2,740 | 7.6% |
[ 1.0% - 1.5% ] 1.03% | 14,073 | 33.0% |
[ 1.0% - 1.5% ] 1.09% | 157,647 | 25.1% |
[ 1.0% - 1.5% ] 1.19% | 44,208 | 10.9% |
[ 1.0% - 1.5% ] 1.26% | 13,516 | 34.3% |
[ 1.0% - 1.5% ] 1.34% | 30,854 | 17.6% |
[ 2.0% - 2.5% ] 2.42% | 8,359 | 67.7% |
[ 2.5% - 3.0% ] 2.92% | 11,455 | 24.1% |
[ 4.5% - 5.0% ] 4.61% | 26,684 | 40.0% |