Ugandan GED/Equivalency

COMPARE

Ugandan
Race
Ancestry
AfghanAfricanAlaska NativeAlaskan AthabascanAlbanianAleutAlsatianAmericanApacheArabArapahoArgentineanArmenianAssyrian/Chaldean/SyriacAustralianAustrianBahamianBangladeshiBarbadianBasqueBelgianBelizeanBermudanBhutaneseBlackfeetBolivianBrazilianBritishBritish West IndianBulgarianBurmeseCajunCambodianCanadianCape VerdeanCarpatho RusynCelticCentral AmericanCentral American IndianCherokeeCheyenneChickasawChileanChineseChippewaChoctawColombianColvilleComancheCosta RicanCreeCreekCroatianCrowCubanCypriotCzechCzechoslovakianDanishDelawareDominicanDutchDutch West IndianEastern EuropeanEcuadorianEgyptianEnglishEstonianEthiopianEuropeanFijianFilipinoFinnishFrenchFrench American IndianFrench CanadianGermanGerman RussianGhanaianGreekGuamanian/ChamorroGuatemalanGuyaneseHaitianHmongHonduranHopiHoumaHungarianIcelanderIndian (Asian)IndonesianInupiatIranianIraqiIrishIroquoisIsraeliItalianJamaicanJapaneseJordanianKenyanKiowaKoreanLaotianLatvianLebaneseLiberianLithuanianLumbeeLuxembourgerMacedonianMalaysianMalteseMarshalleseMenomineeMexicanMexican American IndianMongolianMoroccanNative HawaiianNavajoNepaleseNew ZealanderNicaraguanNigerianNorthern EuropeanNorwegianOkinawanOsageOttawaPaiutePakistaniPalestinianPanamanianParaguayanPennsylvania GermanPeruvianPimaPolishPortuguesePotawatomiPuebloPuerto RicanPuget Sound SalishRomanianRussianSalvadoranSamoanScandinavianScotch-IrishScottishSeminoleSenegaleseSerbianShoshoneSierra LeoneanSiouxSlavicSlovakSloveneSomaliSouth AfricanSouth AmericanSouth American IndianSoviet UnionSpaniardSpanishSpanish AmericanSpanish American IndianSri LankanSubsaharan AfricanSudaneseSwedishSwissSyrianTaiwaneseThaiTlingit-HaidaTohono O'OdhamTonganTrinidadian and TobagonianTsimshianTurkishU.S. Virgin IslanderUgandanUkrainianUruguayanUteVenezuelanVietnameseWelshWest IndianYakamaYaquiYugoslavianYumanYup'ikZimbabwean
Immigration
NonimmigrantsImmigrantsAfghanistanAfricaAlbaniaArgentinaArmeniaAsiaAustraliaAustriaBahamasBangladeshBarbadosBelarusBelgiumBelizeBoliviaBosnia and HerzegovinaBrazilBulgariaBurma/MyanmarCabo VerdeCambodiaCameroonCanadaCaribbeanCentral AmericaChileChinaColombiaCongoCosta RicaCroatiaCubaCzechoslovakiaDenmarkDominicaDominican RepublicEastern AfricaEastern AsiaEastern EuropeEcuadorEgyptEl SalvadorEnglandEritreaEthiopiaEuropeFijiFranceGermanyGhanaGreeceGrenadaGuatemalaGuyanaHaitiHondurasHong KongHungaryIndiaIndonesiaIranIraqIrelandIsraelItalyJamaicaJapanJordanKazakhstanKenyaKoreaKuwaitLaosLatin AmericaLatviaLebanonLiberiaLithuaniaMalaysiaMexicoMicronesiaMiddle AfricaMoldovaMoroccoNepalNetherlandsNicaraguaNigeriaNorth AmericaNorth MacedoniaNorthern AfricaNorthern EuropeNorwayOceaniaPakistanPanamaPeruPhilippinesPolandPortugalRomaniaRussiaSaudi ArabiaScotlandSenegalSerbiaSierra LeoneSingaporeSomaliaSouth AfricaSouth AmericaSouth Central AsiaSouth Eastern AsiaSouthern EuropeSpainSri LankaSt. Vincent and the GrenadinesSudanSwedenSwitzerlandSyriaTaiwanThailandTrinidad and TobagoTurkeyUgandaUkraineUruguayUzbekistanVenezuelaVietnamWest IndiesWestern AfricaWestern AsiaWestern EuropeYemenZaireZimbabweAzores
Select to Compare
Race
Ancestry
AfghanAfricanAlaska NativeAlaskan AthabascanAlbanianAleutAlsatianAmericanApacheArabArapahoArgentineanArmenianAssyrian/Chaldean/SyriacAustralianAustrianBahamianBangladeshiBarbadianBasqueBelgianBelizeanBermudanBhutaneseBlackfeetBolivianBrazilianBritishBritish West IndianBulgarianBurmeseCajunCambodianCanadianCape VerdeanCarpatho RusynCelticCentral AmericanCentral American IndianCherokeeCheyenneChickasawChileanChineseChippewaChoctawColombianColvilleComancheCosta RicanCreeCreekCroatianCrowCubanCypriotCzechCzechoslovakianDanishDelawareDominicanDutchDutch West IndianEastern EuropeanEcuadorianEgyptianEnglishEstonianEthiopianEuropeanFijianFilipinoFinnishFrenchFrench American IndianFrench CanadianGermanGerman RussianGhanaianGreekGuamanian/ChamorroGuatemalanGuyaneseHaitianHmongHonduranHopiHoumaHungarianIcelanderIndian (Asian)IndonesianInupiatIranianIraqiIrishIroquoisIsraeliItalianJamaicanJapaneseJordanianKenyanKiowaKoreanLaotianLatvianLebaneseLiberianLithuanianLumbeeLuxembourgerMacedonianMalaysianMalteseMarshalleseMenomineeMexicanMexican American IndianMongolianMoroccanNative HawaiianNavajoNepaleseNew ZealanderNicaraguanNigerianNorthern EuropeanNorwegianOkinawanOsageOttawaPaiutePakistaniPalestinianPanamanianParaguayanPennsylvania GermanPeruvianPimaPolishPortuguesePotawatomiPuebloPuerto RicanPuget Sound SalishRomanianRussianSalvadoranSamoanScandinavianScotch-IrishScottishSeminoleSenegaleseSerbianShoshoneSierra LeoneanSiouxSlavicSlovakSloveneSomaliSouth AfricanSouth AmericanSouth American IndianSoviet UnionSpaniardSpanishSpanish AmericanSpanish American IndianSri LankanSubsaharan AfricanSudaneseSwedishSwissSyrianTaiwaneseThaiTlingit-HaidaTohono O'OdhamTonganTrinidadian and TobagonianTsimshianTurkishU.S. Virgin IslanderUkrainianUruguayanUteVenezuelanVietnameseWelshWest IndianYakamaYaquiYugoslavianYumanYup'ikZimbabwean
Immigration
NonimmigrantsImmigrantsAfghanistanAfricaAlbaniaArgentinaArmeniaAsiaAustraliaAustriaBahamasBangladeshBarbadosBelarusBelgiumBelizeBoliviaBosnia and HerzegovinaBrazilBulgariaBurma/MyanmarCabo VerdeCambodiaCameroonCanadaCaribbeanCentral AmericaChileChinaColombiaCongoCosta RicaCroatiaCubaCzechoslovakiaDenmarkDominicaDominican RepublicEastern AfricaEastern AsiaEastern EuropeEcuadorEgyptEl SalvadorEnglandEritreaEthiopiaEuropeFijiFranceGermanyGhanaGreeceGrenadaGuatemalaGuyanaHaitiHondurasHong KongHungaryIndiaIndonesiaIranIraqIrelandIsraelItalyJamaicaJapanJordanKazakhstanKenyaKoreaKuwaitLaosLatin AmericaLatviaLebanonLiberiaLithuaniaMalaysiaMexicoMicronesiaMiddle AfricaMoldovaMoroccoNepalNetherlandsNicaraguaNigeriaNorth AmericaNorth MacedoniaNorthern AfricaNorthern EuropeNorwayOceaniaPakistanPanamaPeruPhilippinesPolandPortugalRomaniaRussiaSaudi ArabiaScotlandSenegalSerbiaSierra LeoneSingaporeSomaliaSouth AfricaSouth AmericaSouth Central AsiaSouth Eastern AsiaSouthern EuropeSpainSri LankaSt. Vincent and the GrenadinesSudanSwedenSwitzerlandSyriaTaiwanThailandTrinidad and TobagoTurkeyUgandaUkraineUruguayUzbekistanVenezuelaVietnamWest IndiesWestern AfricaWestern AsiaWestern EuropeYemenZaireZimbabweAzores
GED/Equivalency
Income
Poverty
Unemployment
Labor Participation
Family Structure
Vehicle Availability
Education Level
Disability

Ugandan GED/Equivalency
Good

86.1%
GED/EQUIVALENCY
66.3/ 100
METRIC RATING
163rd/ 347
METRIC RANK

Ugandan GED/Equivalency Correlation Chart

The statistical analysis conducted on geographies consisting of 94,018,260 people shows a slight positive correlation between the proportion of Ugandans and percentage of population with at least ged/equivalency education in the United States with a correlation coefficient (R) of 0.073 and weighted average of 86.1%. On average, for every 1% (one percent) increase in Ugandans within a typical geography, there is an increase of 0.12% in percentage of population with at least ged/equivalency education.
Ugandan GED/Equivalency
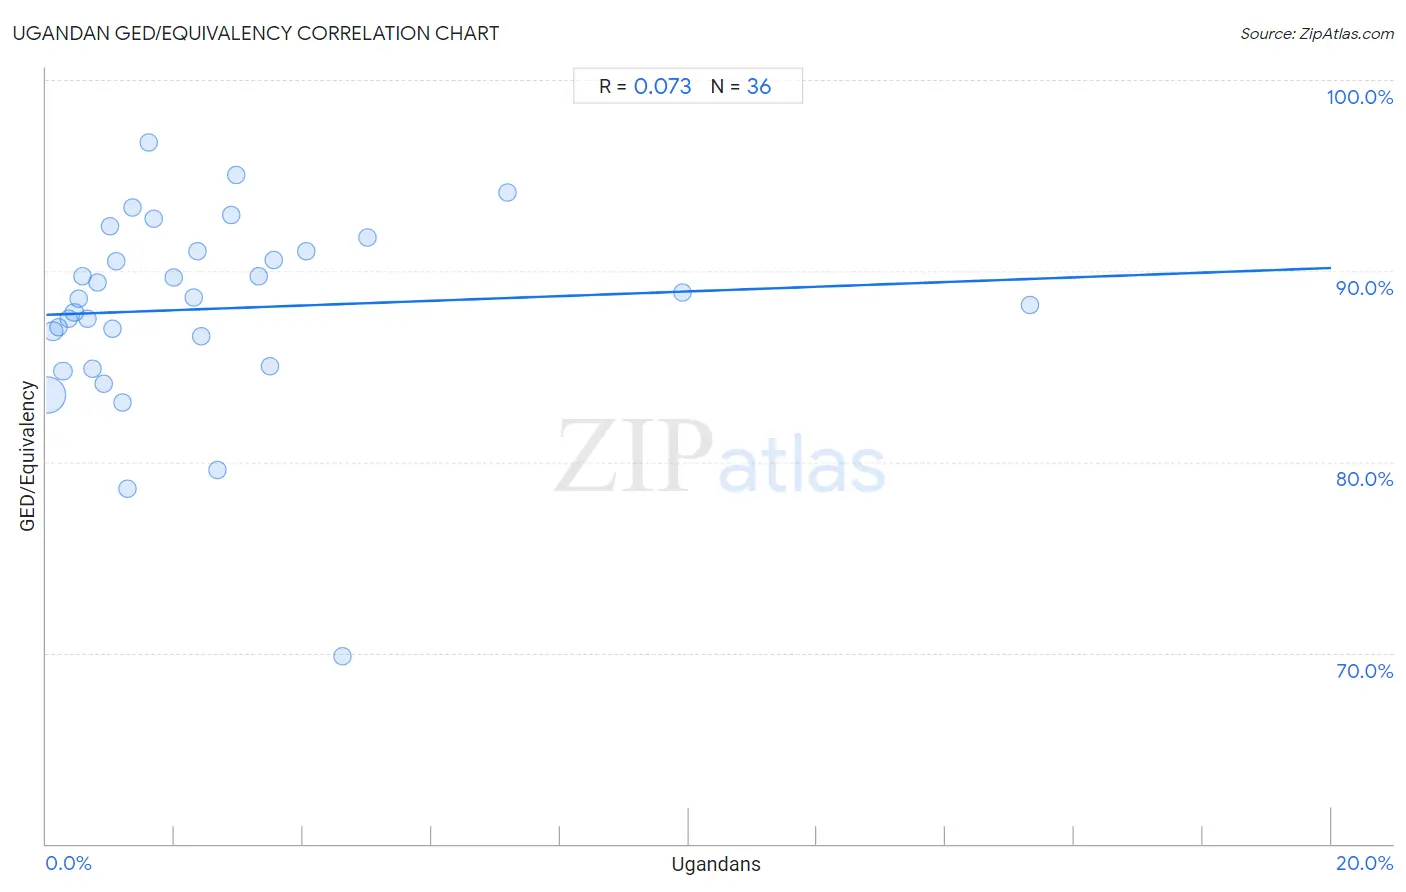
It is essential to understand that the correlation between the percentage of Ugandans and percentage of population with at least ged/equivalency education does not imply a direct cause-and-effect relationship. It remains uncertain whether the presence of Ugandans influences an upward or downward trend in the level of percentage of population with at least ged/equivalency education within an area, or if Ugandans simply ended up residing in those areas with higher or lower levels of percentage of population with at least ged/equivalency education due to other factors.

Demographics Similar to Ugandans by GED/Equivalency

In terms of ged/equivalency, the demographic groups most similar to Ugandans are Venezuelan (86.0%, a difference of 0.020%), Immigrants from Iraq (86.1%, a difference of 0.040%), Alsatian (86.0%, a difference of 0.040%), Immigrants from Albania (86.0%, a difference of 0.050%), and Ethiopian (86.0%, a difference of 0.060%).
DemographicsRating | RankGED/Equivalency
Immigrants from Nepal
73.3
/100
|
#156
Good
86.2%
Whites/Caucasians
72.2
/100
|
#157
Good
86.2%
German Russians
72.1
/100
|
#158
Good
86.2%
Immigrants from Kenya
71.8
/100
|
#159
Good
86.2%
Immigrants from Morocco
69.5
/100
|
#160
Good
86.1%
Immigrants from Syria
69.3
/100
|
#161
Good
86.1%
Immigrants from Iraq
68.1
/100
|
#162
Good
86.1%
Ugandans
66.3
/100
|
#163
Good
86.1%
Venezuelans
65.5
/100
|
#164
Good
86.0%
Alsatians
64.3
/100
|
#165
Good
86.0%
Immigrants from Albania
64.2
/100
|
#166
Good
86.0%
Ethiopians
63.7
/100
|
#167
Good
86.0%
Sierra Leoneans
61.8
/100
|
#168
Good
86.0%
Immigrants from Ethiopia
61.2
/100
|
#169
Good
86.0%
Afghans
59.7
/100
|
#170
Average
85.9%

Ugandan GED/Equivalency Correlation Summary

MeasurementUgandan DataGED/Equivalency Data
Minimum0.016%69.8%
Maximum15.3%96.7%
Range15.3%26.9%
Mean2.5%88.0%
Median1.5%88.6%
Interquartile 25% (IQ1)0.68%85.8%
Interquartile 75% (IQ3)3.1%91.0%
Interquartile Range (IQR)2.4%5.2%
Standard Deviation (Sample)3.0%5.1%
Standard Deviation (Population)3.0%5.0%

Correlation Details

Ugandan PercentileSample SizeGED/Equivalency
[
0.0%
-
0.5%
]
0.016%
81,499,76683.5%
[
0.0%
-
0.5%
]
0.10%
6,235,64586.9%
[
0.0%
-
0.5%
]
0.19%
2,313,26187.0%
[
0.0%
-
0.5%
]
0.26%
1,403,38884.7%
[
0.0%
-
0.5%
]
0.35%
576,21187.5%
[
0.0%
-
0.5%
]
0.44%
564,43187.8%
[
0.0%
-
0.5%
]
0.50%
258,14688.6%
[
0.5%
-
1.0%
]
0.57%
194,87089.7%
[
0.5%
-
1.0%
]
0.64%
253,51987.5%
[
0.5%
-
1.0%
]
0.72%
114,41784.9%
[
0.5%
-
1.0%
]
0.80%
123,60089.4%
[
0.5%
-
1.0%
]
0.90%
39,94184.1%
[
0.5%
-
1.0%
]
0.98%
27,51992.3%
[
1.0%
-
1.5%
]
1.03%
18,17087.0%
[
1.0%
-
1.5%
]
1.10%
163,76790.5%
[
1.0%
-
1.5%
]
1.19%
44,20883.1%
[
1.0%
-
1.5%
]
1.26%
13,51678.6%
[
1.0%
-
1.5%
]
1.34%
49,07493.3%
[
1.5%
-
2.0%
]
1.60%
5,68296.7%
[
1.5%
-
2.0%
]
1.68%
23892.7%
[
1.5%
-
2.0%
]
1.99%
60489.6%
[
2.0%
-
2.5%
]
2.29%
1,04988.6%
[
2.0%
-
2.5%
]
2.36%
14,20291.0%
[
2.0%
-
2.5%
]
2.42%
9,01986.6%
[
2.5%
-
3.0%
]
2.67%
1,01079.6%
[
2.5%
-
3.0%
]
2.87%
16,14592.9%
[
2.5%
-
3.0%
]
2.96%
34,53695.0%
[
3.0%
-
3.5%
]
3.30%
6,42689.7%
[
3.0%
-
3.5%
]
3.47%
2,27485.0%
[
3.5%
-
4.0%
]
3.55%
50790.5%
[
4.0%
-
4.5%
]
4.05%
1,21091.0%
[
4.5%
-
5.0%
]
4.61%
26,68469.8%
[
5.0%
-
5.5%
]
5.00%
18091.7%
[
7.0%
-
7.5%
]
7.17%
2,90094.1%
[
9.5%
-
10.0%
]
9.90%
1,30388.9%
[
15.0%
-
15.5%
]
15.32%
84288.2%