Portuguese GED/Equivalency
COMPARE
Portuguese
Select to Compare
GED/Equivalency
Portuguese GED/Equivalency
85.0%
GED/EQUIVALENCY
15.9/ 100
METRIC RATING
201st/ 347
METRIC RANK
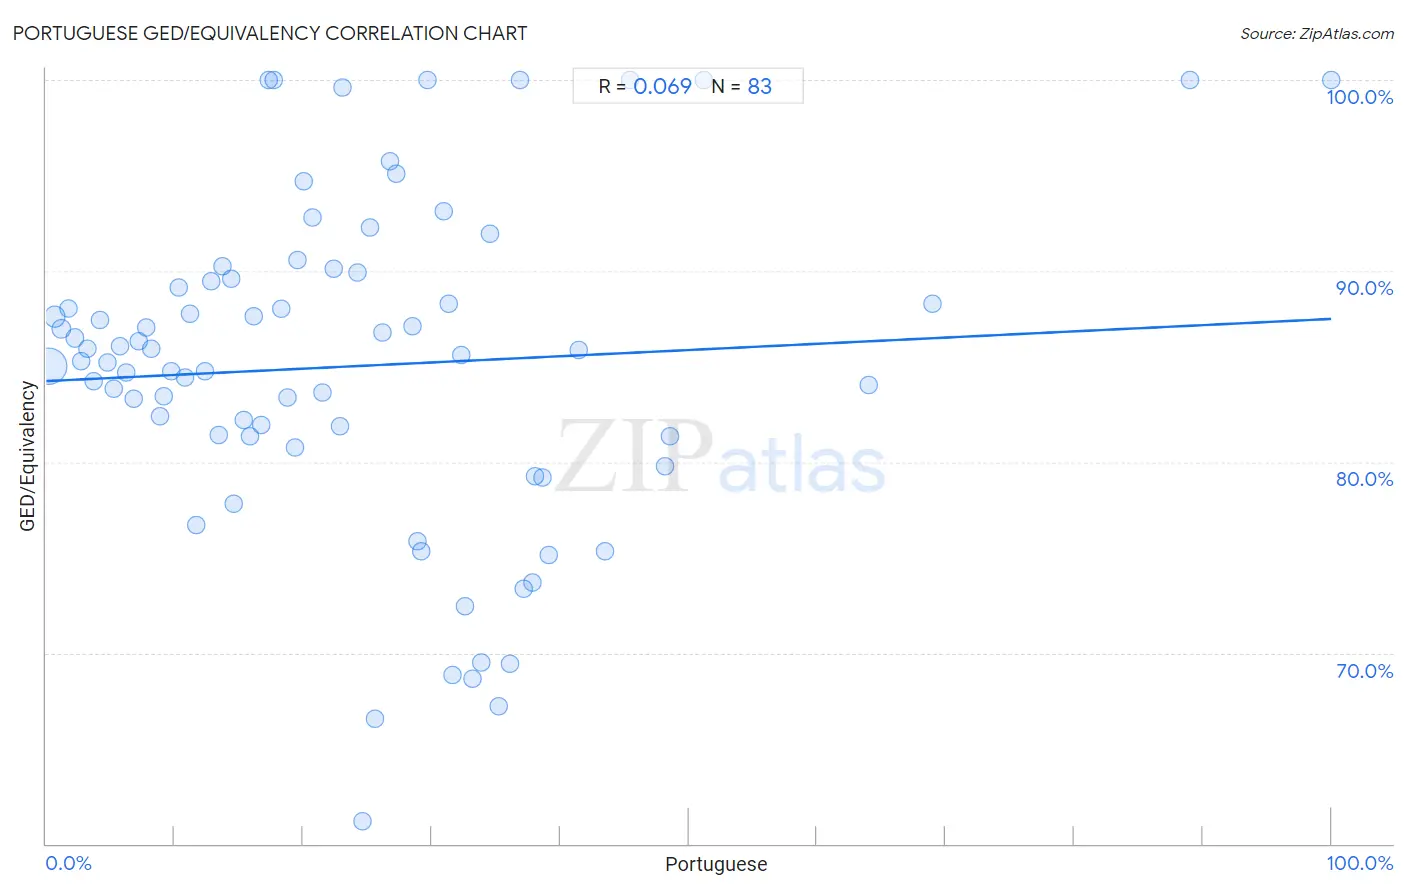
Portuguese GED/Equivalency Correlation Chart
The statistical analysis conducted on geographies consisting of 450,368,110 people shows a slight positive correlation between the proportion of Portuguese and percentage of population with at least ged/equivalency education in the United States with a correlation coefficient (R) of 0.069 and weighted average of 85.0%. On average, for every 1% (one percent) increase in Portuguese within a typical geography, there is an increase of 0.033% in percentage of population with at least ged/equivalency education.
It is essential to understand that the correlation between the percentage of Portuguese and percentage of population with at least ged/equivalency education does not imply a direct cause-and-effect relationship. It remains uncertain whether the presence of Portuguese influences an upward or downward trend in the level of percentage of population with at least ged/equivalency education within an area, or if Portuguese simply ended up residing in those areas with higher or lower levels of percentage of population with at least ged/equivalency education due to other factors.
Demographics Similar to Portuguese by GED/Equivalency
In terms of ged/equivalency, the demographic groups most similar to Portuguese are Uruguayan (85.0%, a difference of 0.0%), Cree (85.0%, a difference of 0.0%), Somali (85.0%, a difference of 0.020%), Panamanian (85.0%, a difference of 0.020%), and Hawaiian (85.0%, a difference of 0.030%).
| Demographics | Rating | Rank | GED/Equivalency |
| Puget Sound Salish | 20.8 /100 | #194 | Fair 85.2% |
| Chippewa | 20.8 /100 | #195 | Fair 85.2% |
| Tongans | 20.7 /100 | #196 | Fair 85.2% |
| Costa Ricans | 20.4 /100 | #197 | Fair 85.2% |
| Immigrants from Africa | 17.5 /100 | #198 | Poor 85.1% |
| Somalis | 16.4 /100 | #199 | Poor 85.0% |
| Uruguayans | 16.0 /100 | #200 | Poor 85.0% |
| Portuguese | 15.9 /100 | #201 | Poor 85.0% |
| Cree | 15.9 /100 | #202 | Poor 85.0% |
| Panamanians | 15.3 /100 | #203 | Poor 85.0% |
| Hawaiians | 15.2 /100 | #204 | Poor 85.0% |
| Liberians | 14.6 /100 | #205 | Poor 85.0% |
| Samoans | 13.7 /100 | #206 | Poor 84.9% |
| Hmong | 13.1 /100 | #207 | Poor 84.9% |
| Marshallese | 12.5 /100 | #208 | Poor 84.9% |
Portuguese GED/Equivalency Correlation Summary
| Measurement | Portuguese Data | GED/Equivalency Data |
| Minimum | 0.18% | 61.2% |
| Maximum | 100.0% | 100.0% |
| Range | 99.8% | 38.8% |
| Mean | 23.9% | 85.0% |
| Median | 20.7% | 85.6% |
| Interquartile 25% (IQ1) | 10.3% | 81.3% |
| Interquartile 75% (IQ3) | 33.2% | 89.6% |
| Interquartile Range (IQR) | 22.9% | 8.3% |
| Standard Deviation (Sample) | 18.5% | 8.7% |
| Standard Deviation (Population) | 18.4% | 8.6% |
Correlation Details
| Portuguese Percentile | Sample Size | GED/Equivalency |
[ 0.0% - 0.5% ] 0.18% | 348,349,742 | 85.0% |
[ 0.5% - 1.0% ] 0.70% | 53,669,589 | 87.6% |
[ 1.0% - 1.5% ] 1.20% | 19,774,035 | 87.0% |
[ 1.5% - 2.0% ] 1.72% | 10,125,046 | 88.1% |
[ 2.0% - 2.5% ] 2.22% | 5,477,912 | 86.5% |
[ 2.5% - 3.0% ] 2.74% | 2,808,155 | 85.3% |
[ 3.0% - 3.5% ] 3.25% | 2,441,959 | 85.9% |
[ 3.5% - 4.0% ] 3.73% | 1,399,136 | 84.2% |
[ 4.0% - 4.5% ] 4.21% | 722,639 | 87.4% |
[ 4.5% - 5.0% ] 4.74% | 847,514 | 85.2% |
[ 5.0% - 5.5% ] 5.23% | 673,472 | 83.8% |
[ 5.5% - 6.0% ] 5.74% | 752,995 | 86.0% |
[ 6.0% - 6.5% ] 6.21% | 425,441 | 84.7% |
[ 6.5% - 7.0% ] 6.78% | 394,303 | 83.3% |
[ 7.0% - 7.5% ] 7.22% | 255,719 | 86.3% |
[ 7.5% - 8.0% ] 7.81% | 363,245 | 87.1% |
[ 8.0% - 8.5% ] 8.19% | 119,887 | 85.9% |
[ 8.5% - 9.0% ] 8.83% | 142,227 | 82.4% |
[ 9.0% - 9.5% ] 9.17% | 142,419 | 83.5% |
[ 9.5% - 10.0% ] 9.75% | 141,032 | 84.7% |
[ 10.0% - 10.5% ] 10.30% | 15,477 | 89.1% |
[ 10.5% - 11.0% ] 10.79% | 61,532 | 84.4% |
[ 11.0% - 11.5% ] 11.22% | 73,198 | 87.8% |
[ 11.5% - 12.0% ] 11.70% | 125,289 | 76.7% |
[ 12.0% - 12.5% ] 12.31% | 20,574 | 84.8% |
[ 12.5% - 13.0% ] 12.85% | 33,616 | 89.5% |
[ 13.0% - 13.5% ] 13.44% | 18,931 | 81.4% |
[ 13.5% - 14.0% ] 13.76% | 25,916 | 90.3% |
[ 14.0% - 14.5% ] 14.37% | 6,401 | 89.6% |
[ 14.5% - 15.0% ] 14.57% | 2,868 | 77.8% |
[ 15.0% - 15.5% ] 15.33% | 7,833 | 82.2% |
[ 15.5% - 16.0% ] 15.81% | 6,475 | 81.4% |
[ 16.0% - 16.5% ] 16.19% | 9,009 | 87.6% |
[ 16.5% - 17.0% ] 16.74% | 19,746 | 81.9% |
[ 17.0% - 17.5% ] 17.31% | 104 | 100.0% |
[ 17.5% - 18.0% ] 17.73% | 141 | 100.0% |
[ 18.0% - 18.5% ] 18.26% | 40,467 | 88.0% |
[ 18.5% - 19.0% ] 18.73% | 82,595 | 83.4% |
[ 19.0% - 19.5% ] 19.35% | 54,661 | 80.8% |
[ 19.5% - 20.0% ] 19.59% | 5,231 | 90.6% |
[ 20.0% - 20.5% ] 20.04% | 6,810 | 94.7% |
[ 20.5% - 21.0% ] 20.72% | 1,699 | 92.8% |
[ 21.0% - 21.5% ] 21.48% | 20,883 | 83.7% |
[ 22.0% - 22.5% ] 22.36% | 13,232 | 90.1% |
[ 22.5% - 23.0% ] 22.84% | 52,833 | 81.9% |
[ 23.0% - 23.5% ] 23.06% | 360 | 99.6% |
[ 24.0% - 24.5% ] 24.24% | 396 | 89.9% |
[ 24.5% - 25.0% ] 24.56% | 16,346 | 61.2% |
[ 25.0% - 25.5% ] 25.16% | 4,463 | 92.3% |
[ 25.5% - 26.0% ] 25.59% | 1,399 | 66.5% |
[ 26.0% - 26.5% ] 26.17% | 10,792 | 86.8% |
[ 26.5% - 27.0% ] 26.79% | 474 | 95.7% |
[ 27.0% - 27.5% ] 27.23% | 7,592 | 95.1% |
[ 28.0% - 28.5% ] 28.50% | 11,117 | 87.1% |
[ 28.5% - 29.0% ] 28.88% | 63,645 | 75.8% |
[ 29.0% - 29.5% ] 29.14% | 21,742 | 75.3% |
[ 29.5% - 30.0% ] 29.63% | 54 | 100.0% |
[ 30.5% - 31.0% ] 30.91% | 495 | 93.1% |
[ 31.0% - 31.5% ] 31.35% | 50,396 | 88.3% |
[ 31.5% - 32.0% ] 31.65% | 18,810 | 68.8% |
[ 32.0% - 32.5% ] 32.30% | 10,466 | 85.6% |
[ 32.5% - 33.0% ] 32.62% | 120,280 | 72.5% |
[ 33.0% - 33.5% ] 33.21% | 8,763 | 68.7% |
[ 33.5% - 34.0% ] 33.89% | 15,718 | 69.5% |
[ 34.5% - 35.0% ] 34.52% | 8,403 | 91.9% |
[ 35.0% - 35.5% ] 35.22% | 17,164 | 67.2% |
[ 36.0% - 36.5% ] 36.09% | 93,789 | 69.4% |
[ 36.5% - 37.0% ] 36.84% | 19 | 100.0% |
[ 37.0% - 37.5% ] 37.20% | 43,238 | 73.4% |
[ 37.5% - 38.0% ] 37.83% | 30,558 | 73.7% |
[ 38.0% - 38.5% ] 38.05% | 21,383 | 79.3% |
[ 38.5% - 39.0% ] 38.59% | 4,556 | 79.2% |
[ 39.0% - 39.5% ] 39.14% | 6,545 | 75.1% |
[ 41.0% - 41.5% ] 41.44% | 11,431 | 85.9% |
[ 43.0% - 43.5% ] 43.45% | 25,084 | 75.3% |
[ 45.0% - 45.5% ] 45.45% | 22 | 100.0% |
[ 48.0% - 48.5% ] 48.18% | 4,660 | 79.8% |
[ 48.5% - 49.0% ] 48.56% | 5,591 | 81.3% |
[ 51.0% - 51.5% ] 51.18% | 127 | 100.0% |
[ 64.0% - 64.5% ] 64.00% | 25 | 84.0% |
[ 68.5% - 69.0% ] 68.94% | 132 | 88.3% |
[ 89.0% - 89.5% ] 89.04% | 73 | 100.0% |
[ 99.5% - 100.0% ] 100.00% | 14 | 100.0% |