Portuguese 2 or more Vehicles in Household
COMPARE
Portuguese
Select to Compare
2 or more Vehicles in Household
Portuguese 2 or more Vehicles in Household
58.6%
2+ VEHICLES AVAILABLE
99.7/ 100
METRIC RATING
64th/ 347
METRIC RANK
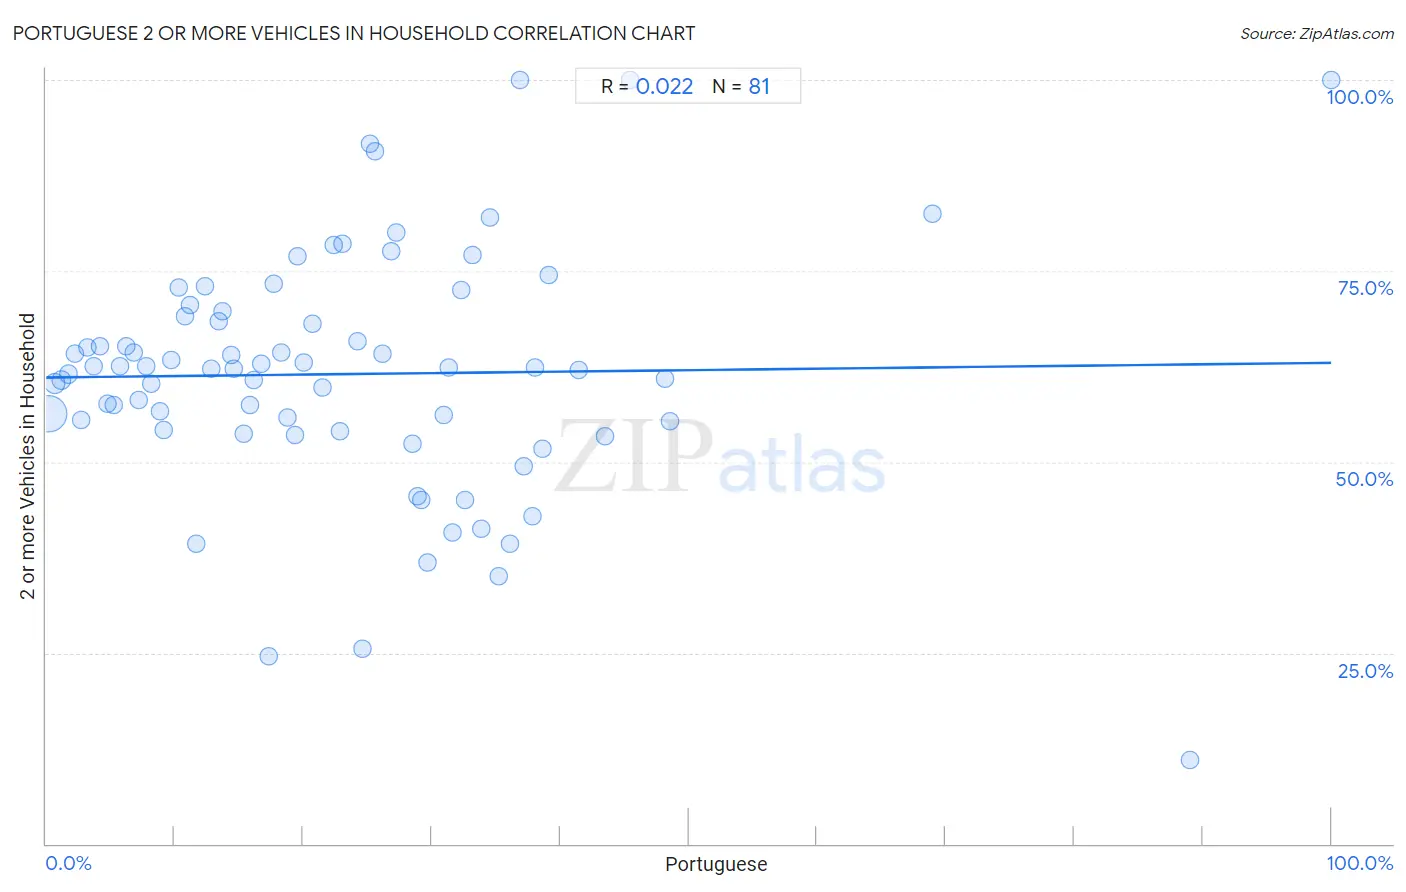
Portuguese 2 or more Vehicles in Household Correlation Chart
The statistical analysis conducted on geographies consisting of 450,032,677 people shows no correlation between the proportion of Portuguese and percentage of households with 2 or more vehicles available in the United States with a correlation coefficient (R) of 0.022 and weighted average of 58.6%. On average, for every 1% (one percent) increase in Portuguese within a typical geography, there is an increase of 0.019% in percentage of households with 2 or more vehicles available.
It is essential to understand that the correlation between the percentage of Portuguese and percentage of households with 2 or more vehicles available does not imply a direct cause-and-effect relationship. It remains uncertain whether the presence of Portuguese influences an upward or downward trend in the level of percentage of households with 2 or more vehicles available within an area, or if Portuguese simply ended up residing in those areas with higher or lower levels of percentage of households with 2 or more vehicles available due to other factors.
Demographics Similar to Portuguese by 2 or more Vehicles in Household
In terms of 2 or more vehicles in household, the demographic groups most similar to Portuguese are Immigrants from Central America (58.6%, a difference of 0.050%), Croatian (58.6%, a difference of 0.060%), Laotian (58.6%, a difference of 0.070%), Canadian (58.6%, a difference of 0.090%), and Mexican American Indian (58.7%, a difference of 0.16%).
| Demographics | Rating | Rank | 2 or more Vehicles in Household |
| Afghans | 99.9 /100 | #57 | Exceptional 59.0% |
| Immigrants from Scotland | 99.8 /100 | #58 | Exceptional 58.9% |
| Spanish Americans | 99.8 /100 | #59 | Exceptional 58.9% |
| French Canadians | 99.8 /100 | #60 | Exceptional 58.9% |
| Osage | 99.8 /100 | #61 | Exceptional 58.8% |
| Nonimmigrants | 99.8 /100 | #62 | Exceptional 58.8% |
| Mexican American Indians | 99.8 /100 | #63 | Exceptional 58.7% |
| Portuguese | 99.7 /100 | #64 | Exceptional 58.6% |
| Immigrants from Central America | 99.7 /100 | #65 | Exceptional 58.6% |
| Croatians | 99.7 /100 | #66 | Exceptional 58.6% |
| Laotians | 99.7 /100 | #67 | Exceptional 58.6% |
| Canadians | 99.7 /100 | #68 | Exceptional 58.6% |
| Pennsylvania Germans | 99.7 /100 | #69 | Exceptional 58.5% |
| Italians | 99.6 /100 | #70 | Exceptional 58.4% |
| Bangladeshis | 99.6 /100 | #71 | Exceptional 58.4% |
Portuguese 2 or more Vehicles in Household Correlation Summary
| Measurement | Portuguese Data | 2 or more Vehicles in Household Data |
| Minimum | 0.18% | 11.0% |
| Maximum | 100.0% | 100.0% |
| Range | 99.8% | 89.0% |
| Mean | 23.1% | 61.5% |
| Median | 20.0% | 62.2% |
| Interquartile 25% (IQ1) | 10.0% | 54.1% |
| Interquartile 75% (IQ3) | 32.5% | 69.4% |
| Interquartile Range (IQR) | 22.4% | 15.3% |
| Standard Deviation (Sample) | 17.9% | 15.9% |
| Standard Deviation (Population) | 17.8% | 15.8% |
Correlation Details
| Portuguese Percentile | Sample Size | 2 or more Vehicles in Household |
[ 0.0% - 0.5% ] 0.18% | 348,127,769 | 56.3% |
[ 0.5% - 1.0% ] 0.70% | 53,624,893 | 60.2% |
[ 1.0% - 1.5% ] 1.20% | 19,748,720 | 60.7% |
[ 1.5% - 2.0% ] 1.72% | 10,098,376 | 61.5% |
[ 2.0% - 2.5% ] 2.22% | 5,469,052 | 64.2% |
[ 2.5% - 3.0% ] 2.74% | 2,807,931 | 55.5% |
[ 3.0% - 3.5% ] 3.24% | 2,441,642 | 65.0% |
[ 3.5% - 4.0% ] 3.73% | 1,393,632 | 62.5% |
[ 4.0% - 4.5% ] 4.21% | 722,280 | 65.2% |
[ 4.5% - 5.0% ] 4.74% | 848,607 | 57.6% |
[ 5.0% - 5.5% ] 5.23% | 673,433 | 57.4% |
[ 5.5% - 6.0% ] 5.74% | 751,986 | 62.5% |
[ 6.0% - 6.5% ] 6.21% | 424,267 | 65.1% |
[ 6.5% - 7.0% ] 6.78% | 394,303 | 64.4% |
[ 7.0% - 7.5% ] 7.22% | 255,719 | 58.1% |
[ 7.5% - 8.0% ] 7.81% | 363,245 | 62.5% |
[ 8.0% - 8.5% ] 8.19% | 119,887 | 60.2% |
[ 8.5% - 9.0% ] 8.83% | 142,227 | 56.7% |
[ 9.0% - 9.5% ] 9.17% | 142,419 | 54.2% |
[ 9.5% - 10.0% ] 9.75% | 141,032 | 63.3% |
[ 10.0% - 10.5% ] 10.30% | 15,477 | 72.9% |
[ 10.5% - 11.0% ] 10.79% | 61,532 | 69.0% |
[ 11.0% - 11.5% ] 11.22% | 73,136 | 70.5% |
[ 11.5% - 12.0% ] 11.70% | 125,289 | 39.2% |
[ 12.0% - 12.5% ] 12.31% | 20,574 | 73.0% |
[ 12.5% - 13.0% ] 12.85% | 33,616 | 62.2% |
[ 13.0% - 13.5% ] 13.44% | 18,931 | 68.4% |
[ 13.5% - 14.0% ] 13.76% | 25,916 | 69.8% |
[ 14.0% - 14.5% ] 14.37% | 6,401 | 64.0% |
[ 14.5% - 15.0% ] 14.57% | 2,868 | 62.2% |
[ 15.0% - 15.5% ] 15.33% | 7,833 | 53.7% |
[ 15.5% - 16.0% ] 15.81% | 6,475 | 57.5% |
[ 16.0% - 16.5% ] 16.19% | 9,009 | 60.8% |
[ 16.5% - 17.0% ] 16.74% | 19,746 | 62.9% |
[ 17.0% - 17.5% ] 17.31% | 104 | 24.6% |
[ 17.5% - 18.0% ] 17.73% | 141 | 73.3% |
[ 18.0% - 18.5% ] 18.26% | 40,467 | 64.3% |
[ 18.5% - 19.0% ] 18.73% | 82,595 | 55.7% |
[ 19.0% - 19.5% ] 19.35% | 54,661 | 53.5% |
[ 19.5% - 20.0% ] 19.59% | 5,231 | 76.9% |
[ 20.0% - 20.5% ] 20.04% | 6,810 | 63.1% |
[ 20.5% - 21.0% ] 20.72% | 1,699 | 68.2% |
[ 21.0% - 21.5% ] 21.48% | 20,883 | 59.7% |
[ 22.0% - 22.5% ] 22.36% | 13,232 | 78.4% |
[ 22.5% - 23.0% ] 22.84% | 52,833 | 54.0% |
[ 23.0% - 23.5% ] 23.06% | 360 | 78.6% |
[ 24.0% - 24.5% ] 24.24% | 396 | 65.7% |
[ 24.5% - 25.0% ] 24.56% | 16,346 | 25.5% |
[ 25.0% - 25.5% ] 25.16% | 4,463 | 91.6% |
[ 25.5% - 26.0% ] 25.59% | 1,399 | 90.7% |
[ 26.0% - 26.5% ] 26.17% | 10,792 | 64.1% |
[ 26.5% - 27.0% ] 26.82% | 302 | 77.5% |
[ 27.0% - 27.5% ] 27.23% | 7,592 | 80.0% |
[ 28.0% - 28.5% ] 28.50% | 11,117 | 52.3% |
[ 28.5% - 29.0% ] 28.88% | 63,645 | 45.6% |
[ 29.0% - 29.5% ] 29.14% | 21,742 | 44.9% |
[ 29.5% - 30.0% ] 29.63% | 54 | 36.8% |
[ 30.5% - 31.0% ] 30.91% | 495 | 56.1% |
[ 31.0% - 31.5% ] 31.35% | 50,396 | 62.4% |
[ 31.5% - 32.0% ] 31.65% | 18,810 | 40.7% |
[ 32.0% - 32.5% ] 32.30% | 10,466 | 72.5% |
[ 32.5% - 33.0% ] 32.62% | 120,280 | 44.9% |
[ 33.0% - 33.5% ] 33.21% | 8,763 | 77.1% |
[ 33.5% - 34.0% ] 33.89% | 15,718 | 41.2% |
[ 34.5% - 35.0% ] 34.52% | 8,403 | 82.0% |
[ 35.0% - 35.5% ] 35.22% | 17,164 | 35.0% |
[ 36.0% - 36.5% ] 36.09% | 93,789 | 39.2% |
[ 36.5% - 37.0% ] 36.84% | 19 | 100.0% |
[ 37.0% - 37.5% ] 37.20% | 43,238 | 49.4% |
[ 37.5% - 38.0% ] 37.83% | 30,558 | 42.8% |
[ 38.0% - 38.5% ] 38.05% | 21,383 | 62.4% |
[ 38.5% - 39.0% ] 38.59% | 4,556 | 51.8% |
[ 39.0% - 39.5% ] 39.14% | 6,545 | 74.5% |
[ 41.0% - 41.5% ] 41.44% | 11,431 | 62.1% |
[ 43.0% - 43.5% ] 43.45% | 25,084 | 53.3% |
[ 45.0% - 45.5% ] 45.45% | 22 | 100.0% |
[ 48.0% - 48.5% ] 48.18% | 4,660 | 60.9% |
[ 48.5% - 49.0% ] 48.56% | 5,591 | 55.2% |
[ 68.5% - 69.0% ] 68.94% | 132 | 82.5% |
[ 89.0% - 89.5% ] 89.04% | 73 | 11.0% |
[ 99.5% - 100.0% ] 100.00% | 14 | 100.0% |