Portuguese 1 or more Vehicles in Household
COMPARE
Portuguese
Select to Compare
1 or more Vehicles in Household
Portuguese 1 or more Vehicles in Household
91.6%
1+ VEHICLES AVAILABLE
99.5/ 100
METRIC RATING
75th/ 347
METRIC RANK
Portuguese 1 or more Vehicles in Household Correlation Chart
The statistical analysis conducted on geographies consisting of 450,036,536 people shows a weak positive correlation between the proportion of Portuguese and percentage of households with 1 or more vehicles available in the United States with a correlation coefficient (R) of 0.201 and weighted average of 91.6%. On average, for every 1% (one percent) increase in Portuguese within a typical geography, there is an increase of 0.056% in percentage of households with 1 or more vehicles available.
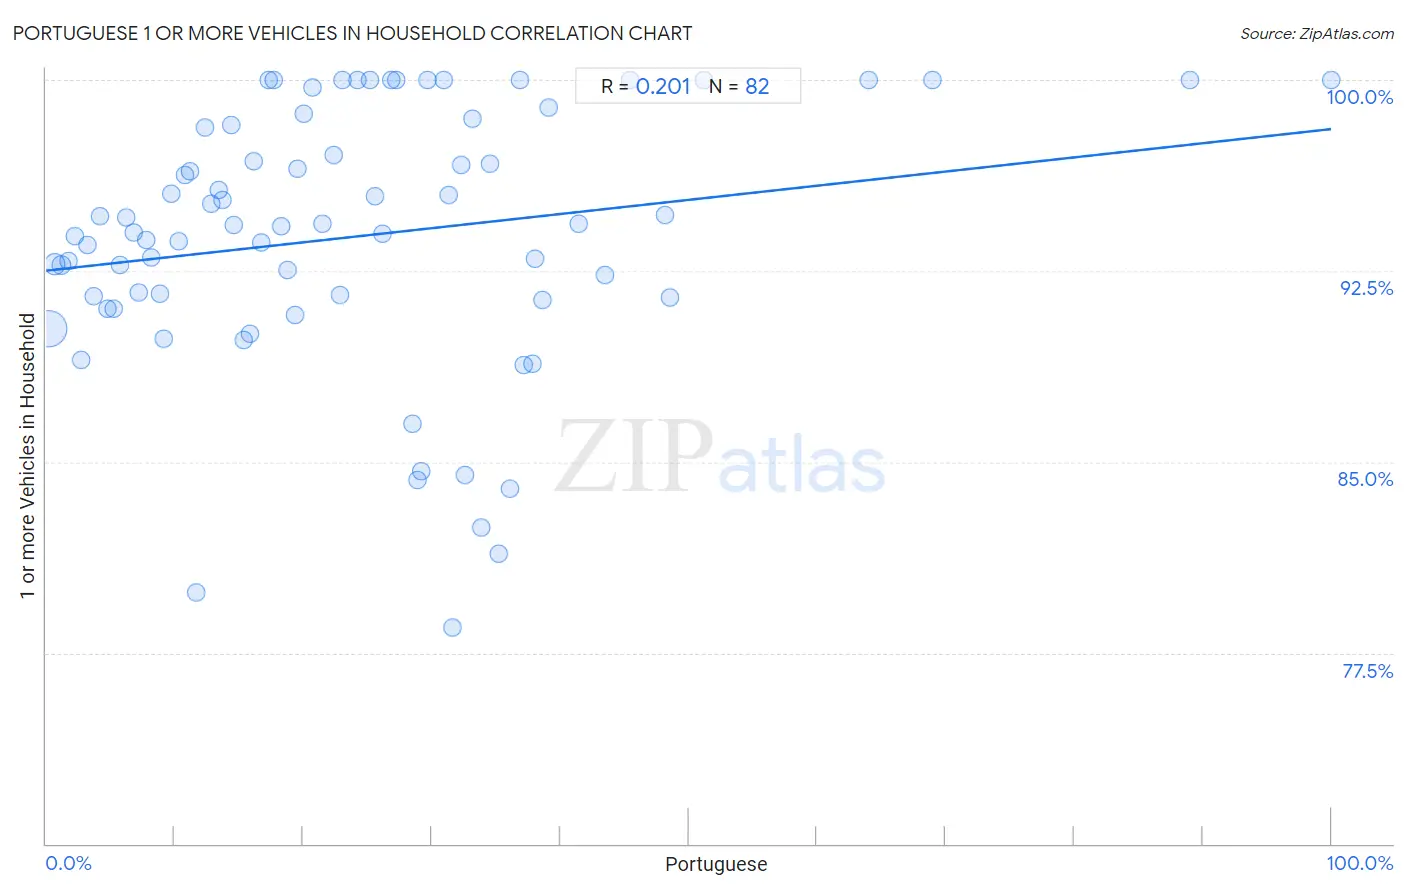
It is essential to understand that the correlation between the percentage of Portuguese and percentage of households with 1 or more vehicles available does not imply a direct cause-and-effect relationship. It remains uncertain whether the presence of Portuguese influences an upward or downward trend in the level of percentage of households with 1 or more vehicles available within an area, or if Portuguese simply ended up residing in those areas with higher or lower levels of percentage of households with 1 or more vehicles available due to other factors.
Demographics Similar to Portuguese by 1 or more Vehicles in Household
In terms of 1 or more vehicles in household, the demographic groups most similar to Portuguese are Cuban (91.5%, a difference of 0.020%), Immigrants from Philippines (91.5%, a difference of 0.060%), Iranian (91.5%, a difference of 0.060%), Immigrants from South Central Asia (91.5%, a difference of 0.080%), and Immigrants from Lebanon (91.6%, a difference of 0.090%).
| Demographics | Rating | Rank | 1 or more Vehicles in Household |
| Immigrants from Scotland | 99.7 /100 | #68 | Exceptional 91.8% |
| Palestinians | 99.7 /100 | #69 | Exceptional 91.7% |
| Lithuanians | 99.7 /100 | #70 | Exceptional 91.7% |
| Poles | 99.7 /100 | #71 | Exceptional 91.7% |
| Cajuns | 99.7 /100 | #72 | Exceptional 91.7% |
| Immigrants from Iran | 99.7 /100 | #73 | Exceptional 91.7% |
| Immigrants from Lebanon | 99.6 /100 | #74 | Exceptional 91.6% |
| Portuguese | 99.5 /100 | #75 | Exceptional 91.6% |
| Cubans | 99.5 /100 | #76 | Exceptional 91.5% |
| Immigrants from Philippines | 99.4 /100 | #77 | Exceptional 91.5% |
| Iranians | 99.4 /100 | #78 | Exceptional 91.5% |
| Immigrants from South Central Asia | 99.4 /100 | #79 | Exceptional 91.5% |
| Bolivians | 99.4 /100 | #80 | Exceptional 91.5% |
| Immigrants from South Eastern Asia | 99.3 /100 | #81 | Exceptional 91.4% |
| Lebanese | 99.3 /100 | #82 | Exceptional 91.4% |
Portuguese 1 or more Vehicles in Household Correlation Summary
| Measurement | Portuguese Data | 1 or more Vehicles in Household Data |
| Minimum | 0.18% | 78.5% |
| Maximum | 100.0% | 100.0% |
| Range | 99.8% | 21.5% |
| Mean | 23.9% | 93.8% |
| Median | 20.4% | 94.3% |
| Interquartile 25% (IQ1) | 10.3% | 91.5% |
| Interquartile 75% (IQ3) | 33.2% | 98.3% |
| Interquartile Range (IQR) | 22.9% | 6.8% |
| Standard Deviation (Sample) | 18.6% | 5.2% |
| Standard Deviation (Population) | 18.5% | 5.1% |
Correlation Details
| Portuguese Percentile | Sample Size | 1 or more Vehicles in Household |
[ 0.0% - 0.5% ] 0.18% | 348,130,374 | 90.2% |
[ 0.5% - 1.0% ] 0.70% | 53,633,493 | 92.8% |
[ 1.0% - 1.5% ] 1.20% | 19,748,720 | 92.7% |
[ 1.5% - 2.0% ] 1.72% | 10,101,978 | 92.9% |
[ 2.0% - 2.5% ] 2.22% | 5,471,046 | 93.9% |
[ 2.5% - 3.0% ] 2.74% | 2,807,931 | 89.0% |
[ 3.0% - 3.5% ] 3.24% | 2,441,642 | 93.5% |
[ 3.5% - 4.0% ] 3.73% | 1,395,454 | 91.5% |
[ 4.0% - 4.5% ] 4.21% | 722,639 | 94.7% |
[ 4.5% - 5.0% ] 4.74% | 848,607 | 91.0% |
[ 5.0% - 5.5% ] 5.23% | 673,433 | 91.0% |
[ 5.5% - 6.0% ] 5.74% | 752,995 | 92.7% |
[ 6.0% - 6.5% ] 6.21% | 424,267 | 94.6% |
[ 6.5% - 7.0% ] 6.78% | 394,303 | 94.0% |
[ 7.0% - 7.5% ] 7.22% | 255,719 | 91.7% |
[ 7.5% - 8.0% ] 7.81% | 363,245 | 93.7% |
[ 8.0% - 8.5% ] 8.19% | 119,887 | 93.0% |
[ 8.5% - 9.0% ] 8.83% | 142,227 | 91.6% |
[ 9.0% - 9.5% ] 9.17% | 142,419 | 89.8% |
[ 9.5% - 10.0% ] 9.75% | 141,032 | 95.5% |
[ 10.0% - 10.5% ] 10.30% | 15,477 | 93.7% |
[ 10.5% - 11.0% ] 10.79% | 61,532 | 96.3% |
[ 11.0% - 11.5% ] 11.22% | 73,198 | 96.4% |
[ 11.5% - 12.0% ] 11.70% | 125,289 | 79.9% |
[ 12.0% - 12.5% ] 12.31% | 20,574 | 98.1% |
[ 12.5% - 13.0% ] 12.85% | 33,616 | 95.1% |
[ 13.0% - 13.5% ] 13.44% | 18,931 | 95.7% |
[ 13.5% - 14.0% ] 13.76% | 25,916 | 95.3% |
[ 14.0% - 14.5% ] 14.37% | 6,401 | 98.3% |
[ 14.5% - 15.0% ] 14.57% | 2,868 | 94.3% |
[ 15.0% - 15.5% ] 15.33% | 7,833 | 89.8% |
[ 15.5% - 16.0% ] 15.81% | 6,475 | 90.0% |
[ 16.0% - 16.5% ] 16.19% | 9,009 | 96.8% |
[ 16.5% - 17.0% ] 16.74% | 19,746 | 93.6% |
[ 17.0% - 17.5% ] 17.31% | 104 | 100.0% |
[ 17.5% - 18.0% ] 17.73% | 141 | 100.0% |
[ 18.0% - 18.5% ] 18.26% | 40,467 | 94.3% |
[ 18.5% - 19.0% ] 18.73% | 82,595 | 92.5% |
[ 19.0% - 19.5% ] 19.35% | 54,661 | 90.8% |
[ 19.5% - 20.0% ] 19.59% | 5,231 | 96.5% |
[ 20.0% - 20.5% ] 20.04% | 6,810 | 98.7% |
[ 20.5% - 21.0% ] 20.72% | 1,699 | 99.7% |
[ 21.0% - 21.5% ] 21.48% | 20,883 | 94.3% |
[ 22.0% - 22.5% ] 22.36% | 13,232 | 97.0% |
[ 22.5% - 23.0% ] 22.84% | 52,833 | 91.5% |
[ 23.0% - 23.5% ] 23.06% | 360 | 100.0% |
[ 24.0% - 24.5% ] 24.24% | 396 | 100.0% |
[ 25.0% - 25.5% ] 25.16% | 4,463 | 100.0% |
[ 25.5% - 26.0% ] 25.59% | 1,399 | 95.4% |
[ 26.0% - 26.5% ] 26.17% | 10,792 | 93.9% |
[ 26.5% - 27.0% ] 26.82% | 302 | 100.0% |
[ 27.0% - 27.5% ] 27.23% | 7,592 | 100.0% |
[ 28.0% - 28.5% ] 28.50% | 11,117 | 86.5% |
[ 28.5% - 29.0% ] 28.88% | 63,645 | 84.3% |
[ 29.0% - 29.5% ] 29.14% | 21,742 | 84.6% |
[ 29.5% - 30.0% ] 29.63% | 54 | 100.0% |
[ 30.5% - 31.0% ] 30.91% | 495 | 100.0% |
[ 31.0% - 31.5% ] 31.35% | 50,396 | 95.5% |
[ 31.5% - 32.0% ] 31.65% | 18,810 | 78.5% |
[ 32.0% - 32.5% ] 32.30% | 10,466 | 96.7% |
[ 32.5% - 33.0% ] 32.62% | 120,280 | 84.5% |
[ 33.0% - 33.5% ] 33.21% | 8,763 | 98.5% |
[ 33.5% - 34.0% ] 33.89% | 15,718 | 82.4% |
[ 34.5% - 35.0% ] 34.52% | 8,403 | 96.7% |
[ 35.0% - 35.5% ] 35.22% | 17,164 | 81.4% |
[ 36.0% - 36.5% ] 36.09% | 93,789 | 84.0% |
[ 36.5% - 37.0% ] 36.84% | 19 | 100.0% |
[ 37.0% - 37.5% ] 37.20% | 43,238 | 88.8% |
[ 37.5% - 38.0% ] 37.83% | 30,558 | 88.8% |
[ 38.0% - 38.5% ] 38.05% | 21,383 | 93.0% |
[ 38.5% - 39.0% ] 38.59% | 4,556 | 91.4% |
[ 39.0% - 39.5% ] 39.14% | 6,545 | 98.9% |
[ 41.0% - 41.5% ] 41.44% | 11,431 | 94.4% |
[ 43.0% - 43.5% ] 43.45% | 25,084 | 92.3% |
[ 45.0% - 45.5% ] 45.45% | 22 | 100.0% |
[ 48.0% - 48.5% ] 48.18% | 4,660 | 94.7% |
[ 48.5% - 49.0% ] 48.56% | 5,591 | 91.5% |
[ 51.0% - 51.5% ] 51.18% | 127 | 100.0% |
[ 64.0% - 64.5% ] 64.00% | 25 | 100.0% |
[ 68.5% - 69.0% ] 68.94% | 132 | 100.0% |
[ 89.0% - 89.5% ] 89.04% | 73 | 100.0% |
[ 99.5% - 100.0% ] 100.00% | 14 | 100.0% |