Portuguese Wage/Income Gap
COMPARE
Portuguese
Select to Compare
Wage/Income Gap
Portuguese Wage/Income Gap
27.4%
WAGE/INCOME GAP
2.2/ 100
METRIC RATING
253rd/ 347
METRIC RANK
Portuguese Wage/Income Gap Correlation Chart
The statistical analysis conducted on geographies consisting of 449,694,788 people shows no correlation between the proportion of Portuguese and wage/income gap percentage in the United States with a correlation coefficient (R) of -0.013 and weighted average of 27.4%. On average, for every 1% (one percent) increase in Portuguese within a typical geography, there is a decrease of 0.0085% in wage/income gap percentage.
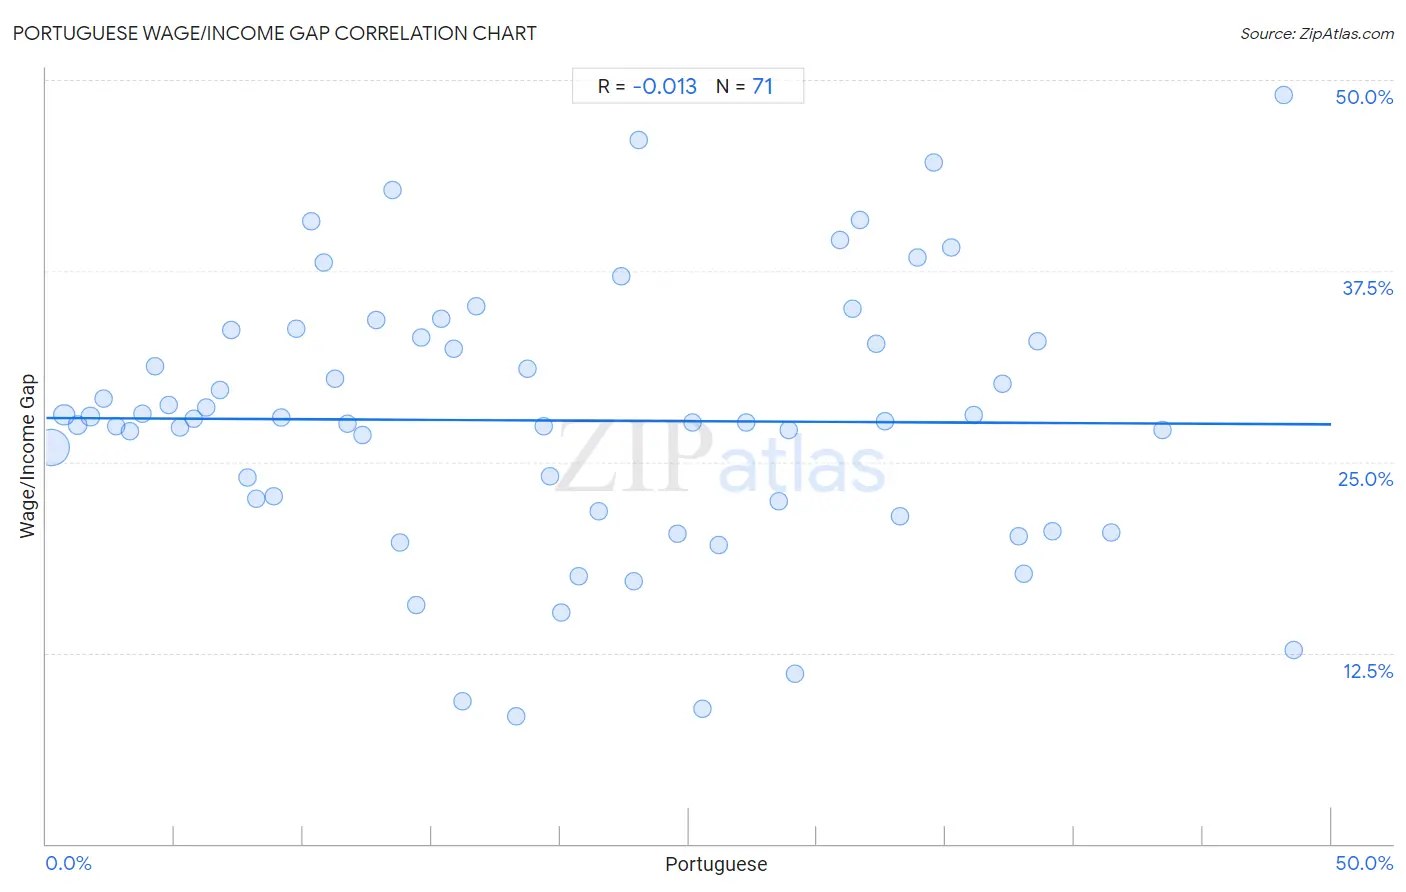
It is essential to understand that the correlation between the percentage of Portuguese and wage/income gap percentage does not imply a direct cause-and-effect relationship. It remains uncertain whether the presence of Portuguese influences an upward or downward trend in the level of wage/income gap percentage within an area, or if Portuguese simply ended up residing in those areas with higher or lower levels of wage/income gap percentage due to other factors.
Demographics Similar to Portuguese by Wage/Income Gap
In terms of wage/income gap, the demographic groups most similar to Portuguese are Israeli (27.4%, a difference of 0.080%), Immigrants from France (27.4%, a difference of 0.090%), Ukrainian (27.3%, a difference of 0.16%), Cherokee (27.4%, a difference of 0.20%), and Immigrants from Norway (27.3%, a difference of 0.22%).
| Demographics | Rating | Rank | Wage/Income Gap |
| Nonimmigrants | 3.3 /100 | #246 | Tragic 27.2% |
| Celtics | 2.8 /100 | #247 | Tragic 27.3% |
| Cypriots | 2.8 /100 | #248 | Tragic 27.3% |
| Carpatho Rusyns | 2.7 /100 | #249 | Tragic 27.3% |
| Immigrants from Czechoslovakia | 2.7 /100 | #250 | Tragic 27.3% |
| Immigrants from Norway | 2.5 /100 | #251 | Tragic 27.3% |
| Ukrainians | 2.4 /100 | #252 | Tragic 27.3% |
| Portuguese | 2.2 /100 | #253 | Tragic 27.4% |
| Israelis | 2.1 /100 | #254 | Tragic 27.4% |
| Immigrants from France | 2.1 /100 | #255 | Tragic 27.4% |
| Cherokee | 1.9 /100 | #256 | Tragic 27.4% |
| Luxembourgers | 1.9 /100 | #257 | Tragic 27.4% |
| Slavs | 1.8 /100 | #258 | Tragic 27.4% |
| Icelanders | 1.8 /100 | #259 | Tragic 27.5% |
| Tongans | 1.7 /100 | #260 | Tragic 27.5% |
Portuguese Wage/Income Gap Correlation Summary
| Measurement | Portuguese Data | Wage/Income Gap Data |
| Minimum | 0.18% | 8.3% |
| Maximum | 48.6% | 49.0% |
| Range | 48.4% | 40.7% |
| Mean | 19.9% | 27.7% |
| Median | 18.7% | 27.7% |
| Interquartile 25% (IQ1) | 8.8% | 21.8% |
| Interquartile 75% (IQ3) | 31.4% | 33.1% |
| Interquartile Range (IQR) | 22.5% | 11.3% |
| Standard Deviation (Sample) | 13.0% | 8.8% |
| Standard Deviation (Population) | 12.9% | 8.7% |
Correlation Details
| Portuguese Percentile | Sample Size | Wage/Income Gap |
[ 0.0% - 0.5% ] 0.18% | 348,150,142 | 25.9% |
[ 0.5% - 1.0% ] 0.70% | 53,493,085 | 28.1% |
[ 1.0% - 1.5% ] 1.20% | 19,708,238 | 27.4% |
[ 1.5% - 2.0% ] 1.72% | 10,078,871 | 28.0% |
[ 2.0% - 2.5% ] 2.22% | 5,452,069 | 29.2% |
[ 2.5% - 3.0% ] 2.74% | 2,775,176 | 27.3% |
[ 3.0% - 3.5% ] 3.25% | 2,417,490 | 27.0% |
[ 3.5% - 4.0% ] 3.73% | 1,390,512 | 28.2% |
[ 4.0% - 4.5% ] 4.21% | 706,119 | 31.2% |
[ 4.5% - 5.0% ] 4.74% | 836,607 | 28.7% |
[ 5.0% - 5.5% ] 5.22% | 661,937 | 27.2% |
[ 5.5% - 6.0% ] 5.74% | 749,751 | 27.8% |
[ 6.0% - 6.5% ] 6.21% | 421,932 | 28.6% |
[ 6.5% - 7.0% ] 6.78% | 386,756 | 29.7% |
[ 7.0% - 7.5% ] 7.22% | 250,373 | 33.7% |
[ 7.5% - 8.0% ] 7.81% | 360,291 | 24.0% |
[ 8.0% - 8.5% ] 8.19% | 117,368 | 22.6% |
[ 8.5% - 9.0% ] 8.83% | 139,956 | 22.7% |
[ 9.0% - 9.5% ] 9.16% | 138,496 | 27.9% |
[ 9.5% - 10.0% ] 9.74% | 138,132 | 33.7% |
[ 10.0% - 10.5% ] 10.32% | 14,069 | 40.7% |
[ 10.5% - 11.0% ] 10.79% | 60,908 | 38.0% |
[ 11.0% - 11.5% ] 11.22% | 71,964 | 30.4% |
[ 11.5% - 12.0% ] 11.70% | 124,693 | 27.5% |
[ 12.0% - 12.5% ] 12.31% | 20,468 | 26.8% |
[ 12.5% - 13.0% ] 12.85% | 32,373 | 34.3% |
[ 13.0% - 13.5% ] 13.46% | 18,171 | 42.8% |
[ 13.5% - 14.0% ] 13.77% | 24,951 | 19.8% |
[ 14.0% - 14.5% ] 14.37% | 6,401 | 15.6% |
[ 14.5% - 15.0% ] 14.57% | 2,821 | 33.1% |
[ 15.0% - 15.5% ] 15.35% | 6,286 | 34.3% |
[ 15.5% - 16.0% ] 15.83% | 5,893 | 32.4% |
[ 16.0% - 16.5% ] 16.19% | 8,855 | 9.4% |
[ 16.5% - 17.0% ] 16.74% | 16,722 | 35.2% |
[ 18.0% - 18.5% ] 18.26% | 40,467 | 8.3% |
[ 18.5% - 19.0% ] 18.73% | 81,856 | 31.1% |
[ 19.0% - 19.5% ] 19.35% | 53,849 | 27.3% |
[ 19.5% - 20.0% ] 19.60% | 4,188 | 24.0% |
[ 20.0% - 20.5% ] 20.04% | 6,511 | 15.1% |
[ 20.5% - 21.0% ] 20.72% | 1,699 | 17.5% |
[ 21.0% - 21.5% ] 21.48% | 20,883 | 21.8% |
[ 22.0% - 22.5% ] 22.36% | 12,614 | 37.1% |
[ 22.5% - 23.0% ] 22.84% | 51,666 | 17.2% |
[ 23.0% - 23.5% ] 23.06% | 360 | 46.1% |
[ 24.5% - 25.0% ] 24.56% | 16,286 | 20.3% |
[ 25.0% - 25.5% ] 25.16% | 4,463 | 27.6% |
[ 25.5% - 26.0% ] 25.54% | 1,155 | 8.8% |
[ 26.0% - 26.5% ] 26.17% | 10,792 | 19.6% |
[ 27.0% - 27.5% ] 27.23% | 7,422 | 27.6% |
[ 28.0% - 28.5% ] 28.50% | 11,117 | 22.4% |
[ 28.5% - 29.0% ] 28.88% | 63,645 | 27.1% |
[ 29.0% - 29.5% ] 29.14% | 21,742 | 11.1% |
[ 30.5% - 31.0% ] 30.91% | 495 | 39.5% |
[ 31.0% - 31.5% ] 31.35% | 50,072 | 35.1% |
[ 31.5% - 32.0% ] 31.65% | 18,445 | 40.8% |
[ 32.0% - 32.5% ] 32.30% | 10,466 | 32.7% |
[ 32.5% - 33.0% ] 32.62% | 120,137 | 27.7% |
[ 33.0% - 33.5% ] 33.21% | 8,763 | 21.5% |
[ 33.5% - 34.0% ] 33.89% | 15,629 | 38.4% |
[ 34.5% - 35.0% ] 34.52% | 8,403 | 44.6% |
[ 35.0% - 35.5% ] 35.22% | 17,164 | 39.0% |
[ 36.0% - 36.5% ] 36.09% | 93,638 | 28.1% |
[ 37.0% - 37.5% ] 37.20% | 43,238 | 30.1% |
[ 37.5% - 38.0% ] 37.83% | 30,558 | 20.1% |
[ 38.0% - 38.5% ] 38.05% | 21,383 | 17.6% |
[ 38.5% - 39.0% ] 38.59% | 4,556 | 32.9% |
[ 39.0% - 39.5% ] 39.14% | 6,484 | 20.4% |
[ 41.0% - 41.5% ] 41.44% | 11,431 | 20.4% |
[ 43.0% - 43.5% ] 43.45% | 25,084 | 27.1% |
[ 48.0% - 48.5% ] 48.18% | 4,660 | 49.0% |
[ 48.5% - 49.0% ] 48.56% | 5,591 | 12.7% |