Portuguese Married-Couple Family Poverty
COMPARE
Portuguese
Select to Compare
Married-Couple Family Poverty
Portuguese Married-Couple Family Poverty
4.6%
POVERTY | MARRIED-COUPLE FAMILIES
98.3/ 100
METRIC RATING
95th/ 347
METRIC RANK
Portuguese Married-Couple Family Poverty Correlation Chart
The statistical analysis conducted on geographies consisting of 444,135,508 people shows a slight positive correlation between the proportion of Portuguese and poverty level among married-couple families in the United States with a correlation coefficient (R) of 0.067 and weighted average of 4.6%. On average, for every 1% (one percent) increase in Portuguese within a typical geography, there is an increase of 0.015% in poverty level among married-couple families.
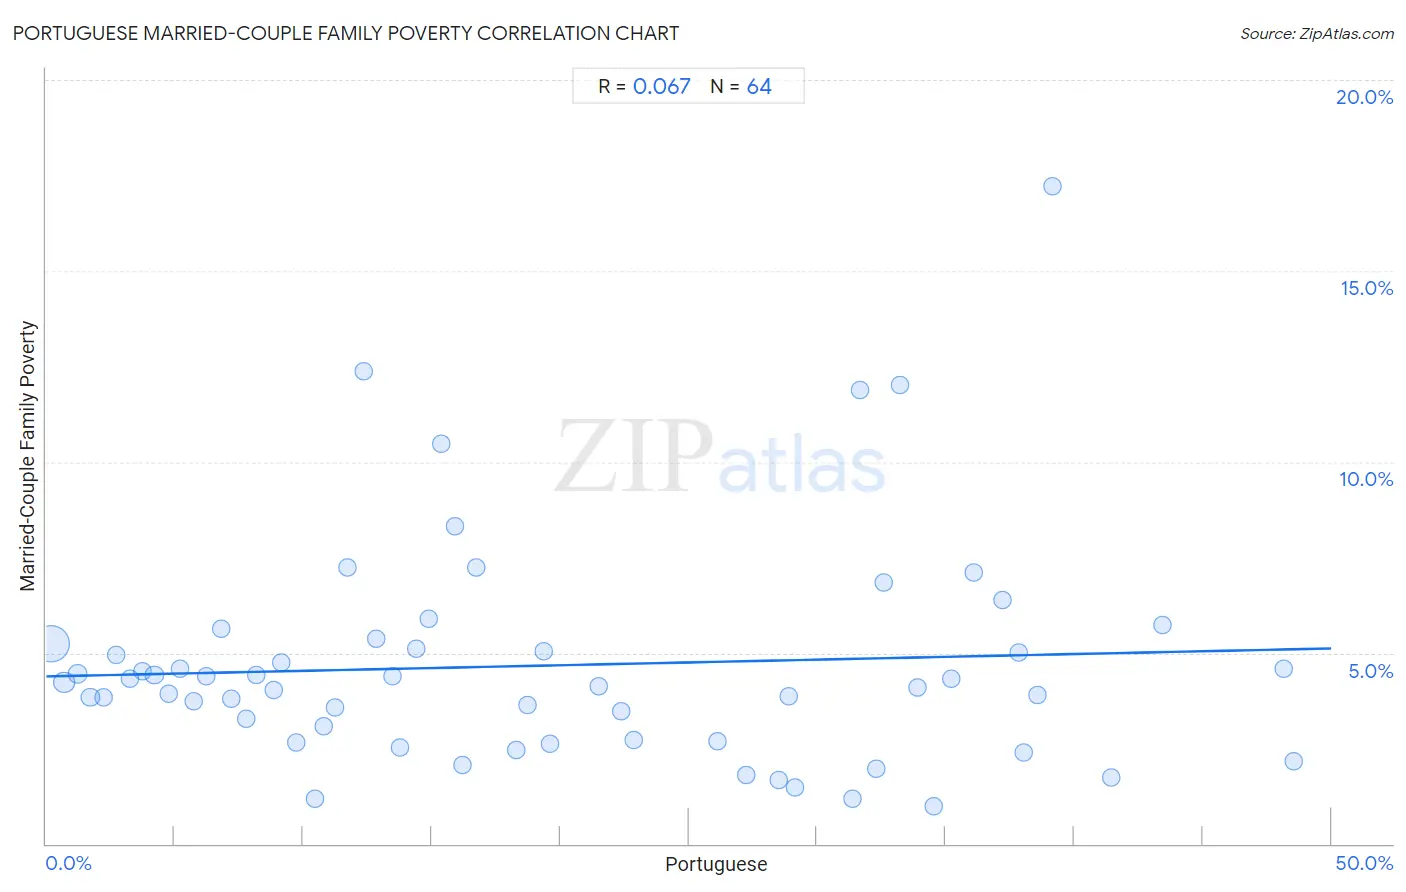
It is essential to understand that the correlation between the percentage of Portuguese and poverty level among married-couple families does not imply a direct cause-and-effect relationship. It remains uncertain whether the presence of Portuguese influences an upward or downward trend in the level of poverty level among married-couple families within an area, or if Portuguese simply ended up residing in those areas with higher or lower levels of poverty level among married-couple families due to other factors.
Demographics Similar to Portuguese by Married-Couple Family Poverty
In terms of married-couple family poverty, the demographic groups most similar to Portuguese are Immigrants from Italy (4.6%, a difference of 0.040%), Immigrants from Poland (4.6%, a difference of 0.080%), Korean (4.6%, a difference of 0.090%), Immigrants from Belgium (4.6%, a difference of 0.13%), and Immigrants from Norway (4.6%, a difference of 0.27%).
| Demographics | Rating | Rank | Married-Couple Family Poverty |
| Bolivians | 98.6 /100 | #88 | Exceptional 4.6% |
| Immigrants from Czechoslovakia | 98.5 /100 | #89 | Exceptional 4.6% |
| Immigrants from Switzerland | 98.5 /100 | #90 | Exceptional 4.6% |
| Basques | 98.5 /100 | #91 | Exceptional 4.6% |
| Immigrants from Norway | 98.4 /100 | #92 | Exceptional 4.6% |
| Koreans | 98.3 /100 | #93 | Exceptional 4.6% |
| Immigrants from Italy | 98.3 /100 | #94 | Exceptional 4.6% |
| Portuguese | 98.3 /100 | #95 | Exceptional 4.6% |
| Immigrants from Poland | 98.3 /100 | #96 | Exceptional 4.6% |
| Immigrants from Belgium | 98.2 /100 | #97 | Exceptional 4.6% |
| Native Hawaiians | 98.0 /100 | #98 | Exceptional 4.6% |
| Immigrants from Europe | 97.9 /100 | #99 | Exceptional 4.6% |
| Immigrants from Western Europe | 97.9 /100 | #100 | Exceptional 4.6% |
| Yugoslavians | 97.8 /100 | #101 | Exceptional 4.6% |
| Asians | 97.6 /100 | #102 | Exceptional 4.7% |
Portuguese Married-Couple Family Poverty Correlation Summary
| Measurement | Portuguese Data | Married-Couple Family Poverty Data |
| Minimum | 0.18% | 0.98% |
| Maximum | 48.6% | 17.2% |
| Range | 48.4% | 16.2% |
| Mean | 19.5% | 4.7% |
| Median | 16.1% | 4.2% |
| Interquartile 25% (IQ1) | 8.0% | 2.7% |
| Interquartile 75% (IQ3) | 32.0% | 5.2% |
| Interquartile Range (IQR) | 24.0% | 2.5% |
| Standard Deviation (Sample) | 13.5% | 2.9% |
| Standard Deviation (Population) | 13.4% | 2.9% |
Correlation Details
| Portuguese Percentile | Sample Size | Married-Couple Family Poverty |
[ 0.0% - 0.5% ] 0.18% | 345,212,519 | 5.2% |
[ 0.5% - 1.0% ] 0.70% | 52,417,280 | 4.2% |
[ 1.0% - 1.5% ] 1.20% | 19,141,177 | 4.5% |
[ 1.5% - 2.0% ] 1.72% | 9,795,998 | 3.8% |
[ 2.0% - 2.5% ] 2.22% | 5,283,562 | 3.8% |
[ 2.5% - 3.0% ] 2.74% | 2,680,925 | 4.9% |
[ 3.0% - 3.5% ] 3.25% | 2,327,678 | 4.3% |
[ 3.5% - 4.0% ] 3.73% | 1,336,624 | 4.5% |
[ 4.0% - 4.5% ] 4.21% | 641,190 | 4.4% |
[ 4.5% - 5.0% ] 4.74% | 816,829 | 3.9% |
[ 5.0% - 5.5% ] 5.23% | 641,555 | 4.6% |
[ 5.5% - 6.0% ] 5.74% | 740,942 | 3.7% |
[ 6.0% - 6.5% ] 6.20% | 397,311 | 4.4% |
[ 6.5% - 7.0% ] 6.79% | 368,927 | 5.6% |
[ 7.0% - 7.5% ] 7.21% | 246,884 | 3.8% |
[ 7.5% - 8.0% ] 7.81% | 338,124 | 3.3% |
[ 8.0% - 8.5% ] 8.19% | 117,205 | 4.4% |
[ 8.5% - 9.0% ] 8.83% | 128,896 | 4.0% |
[ 9.0% - 9.5% ] 9.16% | 137,272 | 4.7% |
[ 9.5% - 10.0% ] 9.75% | 128,317 | 2.7% |
[ 10.0% - 10.5% ] 10.47% | 3,840 | 1.2% |
[ 10.5% - 11.0% ] 10.80% | 57,302 | 3.1% |
[ 11.0% - 11.5% ] 11.22% | 70,364 | 3.6% |
[ 11.5% - 12.0% ] 11.70% | 124,158 | 7.2% |
[ 12.0% - 12.5% ] 12.33% | 17,376 | 12.4% |
[ 12.5% - 13.0% ] 12.86% | 28,950 | 5.4% |
[ 13.0% - 13.5% ] 13.45% | 18,331 | 4.4% |
[ 13.5% - 14.0% ] 13.76% | 25,180 | 2.5% |
[ 14.0% - 14.5% ] 14.37% | 6,401 | 5.1% |
[ 14.5% - 15.0% ] 14.89% | 47 | 5.9% |
[ 15.0% - 15.5% ] 15.38% | 6,301 | 10.5% |
[ 15.5% - 16.0% ] 15.91% | 3,803 | 8.3% |
[ 16.0% - 16.5% ] 16.19% | 8,855 | 2.1% |
[ 16.5% - 17.0% ] 16.74% | 16,722 | 7.2% |
[ 18.0% - 18.5% ] 18.28% | 37,822 | 2.4% |
[ 18.5% - 19.0% ] 18.73% | 82,595 | 3.6% |
[ 19.0% - 19.5% ] 19.35% | 53,635 | 5.0% |
[ 19.5% - 20.0% ] 19.61% | 4,334 | 2.6% |
[ 21.0% - 21.5% ] 21.48% | 20,883 | 4.1% |
[ 22.0% - 22.5% ] 22.36% | 13,232 | 3.5% |
[ 22.5% - 23.0% ] 22.84% | 52,833 | 2.7% |
[ 26.0% - 26.5% ] 26.13% | 8,101 | 2.7% |
[ 27.0% - 27.5% ] 27.22% | 6,768 | 1.8% |
[ 28.0% - 28.5% ] 28.50% | 11,117 | 1.7% |
[ 28.5% - 29.0% ] 28.88% | 62,947 | 3.9% |
[ 29.0% - 29.5% ] 29.14% | 21,742 | 1.5% |
[ 31.0% - 31.5% ] 31.35% | 50,072 | 1.2% |
[ 31.5% - 32.0% ] 31.65% | 18,445 | 11.9% |
[ 32.0% - 32.5% ] 32.30% | 10,466 | 2.0% |
[ 32.5% - 33.0% ] 32.57% | 100,620 | 6.8% |
[ 33.0% - 33.5% ] 33.21% | 8,763 | 12.0% |
[ 33.5% - 34.0% ] 33.89% | 15,718 | 4.1% |
[ 34.5% - 35.0% ] 34.52% | 4,783 | 0.98% |
[ 35.0% - 35.5% ] 35.22% | 17,164 | 4.3% |
[ 36.0% - 36.5% ] 36.09% | 93,638 | 7.1% |
[ 37.0% - 37.5% ] 37.20% | 43,238 | 6.4% |
[ 37.5% - 38.0% ] 37.83% | 30,558 | 5.0% |
[ 38.0% - 38.5% ] 38.05% | 21,383 | 2.4% |
[ 38.5% - 39.0% ] 38.59% | 4,556 | 3.9% |
[ 39.0% - 39.5% ] 39.14% | 6,484 | 17.2% |
[ 41.0% - 41.5% ] 41.44% | 11,431 | 1.7% |
[ 43.0% - 43.5% ] 43.45% | 25,084 | 5.7% |
[ 48.0% - 48.5% ] 48.18% | 4,660 | 4.6% |
[ 48.5% - 49.0% ] 48.56% | 5,591 | 2.1% |