Portuguese Disability Age Under 5

COMPARE

Portuguese
Race
Ancestry
AfghanAfricanAlaska NativeAlaskan AthabascanAlbanianAleutAlsatianAmericanApacheArabArapahoArgentineanArmenianAssyrian/Chaldean/SyriacAustralianAustrianBahamianBangladeshiBarbadianBasqueBelgianBelizeanBermudanBhutaneseBlackfeetBolivianBrazilianBritishBritish West IndianBulgarianBurmeseCajunCambodianCanadianCape VerdeanCarpatho RusynCelticCentral AmericanCentral American IndianCherokeeCheyenneChickasawChileanChineseChippewaChoctawColombianColvilleComancheCosta RicanCreeCreekCroatianCrowCubanCypriotCzechCzechoslovakianDanishDelawareDominicanDutchDutch West IndianEastern EuropeanEcuadorianEgyptianEnglishEstonianEthiopianEuropeanFijianFilipinoFinnishFrenchFrench American IndianFrench CanadianGermanGerman RussianGhanaianGreekGuamanian/ChamorroGuatemalanGuyaneseHaitianHmongHonduranHopiHoumaHungarianIcelanderIndian (Asian)IndonesianInupiatIranianIraqiIrishIroquoisIsraeliItalianJamaicanJapaneseJordanianKenyanKiowaKoreanLaotianLatvianLebaneseLiberianLithuanianLumbeeLuxembourgerMacedonianMalaysianMalteseMarshalleseMenomineeMexicanMexican American IndianMongolianMoroccanNative HawaiianNavajoNepaleseNew ZealanderNicaraguanNigerianNorthern EuropeanNorwegianOkinawanOsageOttawaPaiutePakistaniPalestinianPanamanianParaguayanPennsylvania GermanPeruvianPimaPolishPortuguesePotawatomiPuebloPuerto RicanPuget Sound SalishRomanianRussianSalvadoranSamoanScandinavianScotch-IrishScottishSeminoleSenegaleseSerbianShoshoneSierra LeoneanSiouxSlavicSlovakSloveneSomaliSouth AfricanSouth AmericanSouth American IndianSoviet UnionSpaniardSpanishSpanish AmericanSpanish American IndianSri LankanSubsaharan AfricanSudaneseSwedishSwissSyrianTaiwaneseThaiTlingit-HaidaTohono O'OdhamTonganTrinidadian and TobagonianTsimshianTurkishU.S. Virgin IslanderUgandanUkrainianUruguayanUteVenezuelanVietnameseWelshWest IndianYakamaYaquiYugoslavianYumanYup'ikZimbabwean
Immigration
NonimmigrantsImmigrantsAfghanistanAfricaAlbaniaArgentinaArmeniaAsiaAustraliaAustriaBahamasBangladeshBarbadosBelarusBelgiumBelizeBoliviaBosnia and HerzegovinaBrazilBulgariaBurma/MyanmarCabo VerdeCambodiaCameroonCanadaCaribbeanCentral AmericaChileChinaColombiaCongoCosta RicaCroatiaCubaCzechoslovakiaDenmarkDominicaDominican RepublicEastern AfricaEastern AsiaEastern EuropeEcuadorEgyptEl SalvadorEnglandEritreaEthiopiaEuropeFijiFranceGermanyGhanaGreeceGrenadaGuatemalaGuyanaHaitiHondurasHong KongHungaryIndiaIndonesiaIranIraqIrelandIsraelItalyJamaicaJapanJordanKazakhstanKenyaKoreaKuwaitLaosLatin AmericaLatviaLebanonLiberiaLithuaniaMalaysiaMexicoMicronesiaMiddle AfricaMoldovaMoroccoNepalNetherlandsNicaraguaNigeriaNorth AmericaNorth MacedoniaNorthern AfricaNorthern EuropeNorwayOceaniaPakistanPanamaPeruPhilippinesPolandPortugalRomaniaRussiaSaudi ArabiaScotlandSenegalSerbiaSierra LeoneSingaporeSomaliaSouth AfricaSouth AmericaSouth Central AsiaSouth Eastern AsiaSouthern EuropeSpainSri LankaSt. Vincent and the GrenadinesSudanSwedenSwitzerlandSyriaTaiwanThailandTrinidad and TobagoTurkeyUgandaUkraineUruguayUzbekistanVenezuelaVietnamWest IndiesWestern AfricaWestern AsiaWestern EuropeYemenZaireZimbabweAzores
Select to Compare
Race
Ancestry
AfghanAfricanAlaska NativeAlaskan AthabascanAlbanianAleutAlsatianAmericanApacheArabArapahoArgentineanArmenianAssyrian/Chaldean/SyriacAustralianAustrianBahamianBangladeshiBarbadianBasqueBelgianBelizeanBermudanBhutaneseBlackfeetBolivianBrazilianBritishBritish West IndianBulgarianBurmeseCajunCambodianCanadianCape VerdeanCarpatho RusynCelticCentral AmericanCentral American IndianCherokeeCheyenneChickasawChileanChineseChippewaChoctawColombianColvilleComancheCosta RicanCreeCreekCroatianCrowCubanCypriotCzechCzechoslovakianDanishDelawareDominicanDutchDutch West IndianEastern EuropeanEcuadorianEgyptianEnglishEstonianEthiopianEuropeanFijianFilipinoFinnishFrenchFrench American IndianFrench CanadianGermanGerman RussianGhanaianGreekGuamanian/ChamorroGuatemalanGuyaneseHaitianHmongHonduranHopiHoumaHungarianIcelanderIndian (Asian)IndonesianInupiatIranianIraqiIrishIroquoisIsraeliItalianJamaicanJapaneseJordanianKenyanKiowaKoreanLaotianLatvianLebaneseLiberianLithuanianLumbeeLuxembourgerMacedonianMalaysianMalteseMarshalleseMenomineeMexicanMexican American IndianMongolianMoroccanNative HawaiianNavajoNepaleseNew ZealanderNicaraguanNigerianNorthern EuropeanNorwegianOkinawanOsageOttawaPaiutePakistaniPalestinianPanamanianParaguayanPennsylvania GermanPeruvianPimaPolishPotawatomiPuebloPuerto RicanPuget Sound SalishRomanianRussianSalvadoranSamoanScandinavianScotch-IrishScottishSeminoleSenegaleseSerbianShoshoneSierra LeoneanSiouxSlavicSlovakSloveneSomaliSouth AfricanSouth AmericanSouth American IndianSoviet UnionSpaniardSpanishSpanish AmericanSpanish American IndianSri LankanSubsaharan AfricanSudaneseSwedishSwissSyrianTaiwaneseThaiTlingit-HaidaTohono O'OdhamTonganTrinidadian and TobagonianTsimshianTurkishU.S. Virgin IslanderUgandanUkrainianUruguayanUteVenezuelanVietnameseWelshWest IndianYakamaYaquiYugoslavianYumanYup'ikZimbabwean
Immigration
NonimmigrantsImmigrantsAfghanistanAfricaAlbaniaArgentinaArmeniaAsiaAustraliaAustriaBahamasBangladeshBarbadosBelarusBelgiumBelizeBoliviaBosnia and HerzegovinaBrazilBulgariaBurma/MyanmarCabo VerdeCambodiaCameroonCanadaCaribbeanCentral AmericaChileChinaColombiaCongoCosta RicaCroatiaCubaCzechoslovakiaDenmarkDominicaDominican RepublicEastern AfricaEastern AsiaEastern EuropeEcuadorEgyptEl SalvadorEnglandEritreaEthiopiaEuropeFijiFranceGermanyGhanaGreeceGrenadaGuatemalaGuyanaHaitiHondurasHong KongHungaryIndiaIndonesiaIranIraqIrelandIsraelItalyJamaicaJapanJordanKazakhstanKenyaKoreaKuwaitLaosLatin AmericaLatviaLebanonLiberiaLithuaniaMalaysiaMexicoMicronesiaMiddle AfricaMoldovaMoroccoNepalNetherlandsNicaraguaNigeriaNorth AmericaNorth MacedoniaNorthern AfricaNorthern EuropeNorwayOceaniaPakistanPanamaPeruPhilippinesPolandPortugalRomaniaRussiaSaudi ArabiaScotlandSenegalSerbiaSierra LeoneSingaporeSomaliaSouth AfricaSouth AmericaSouth Central AsiaSouth Eastern AsiaSouthern EuropeSpainSri LankaSt. Vincent and the GrenadinesSudanSwedenSwitzerlandSyriaTaiwanThailandTrinidad and TobagoTurkeyUgandaUkraineUruguayUzbekistanVenezuelaVietnamWest IndiesWestern AfricaWestern AsiaWestern EuropeYemenZaireZimbabweAzores
Disability Age Under 5
Income
Poverty
Unemployment
Labor Participation
Family Structure
Vehicle Availability
Education Level
Disability

Portuguese Disability Age Under 5
Tragic

1.6%
DISABILITY | AGE UNDER 5
0.0/ 100
METRIC RATING
299th/ 347
METRIC RANK

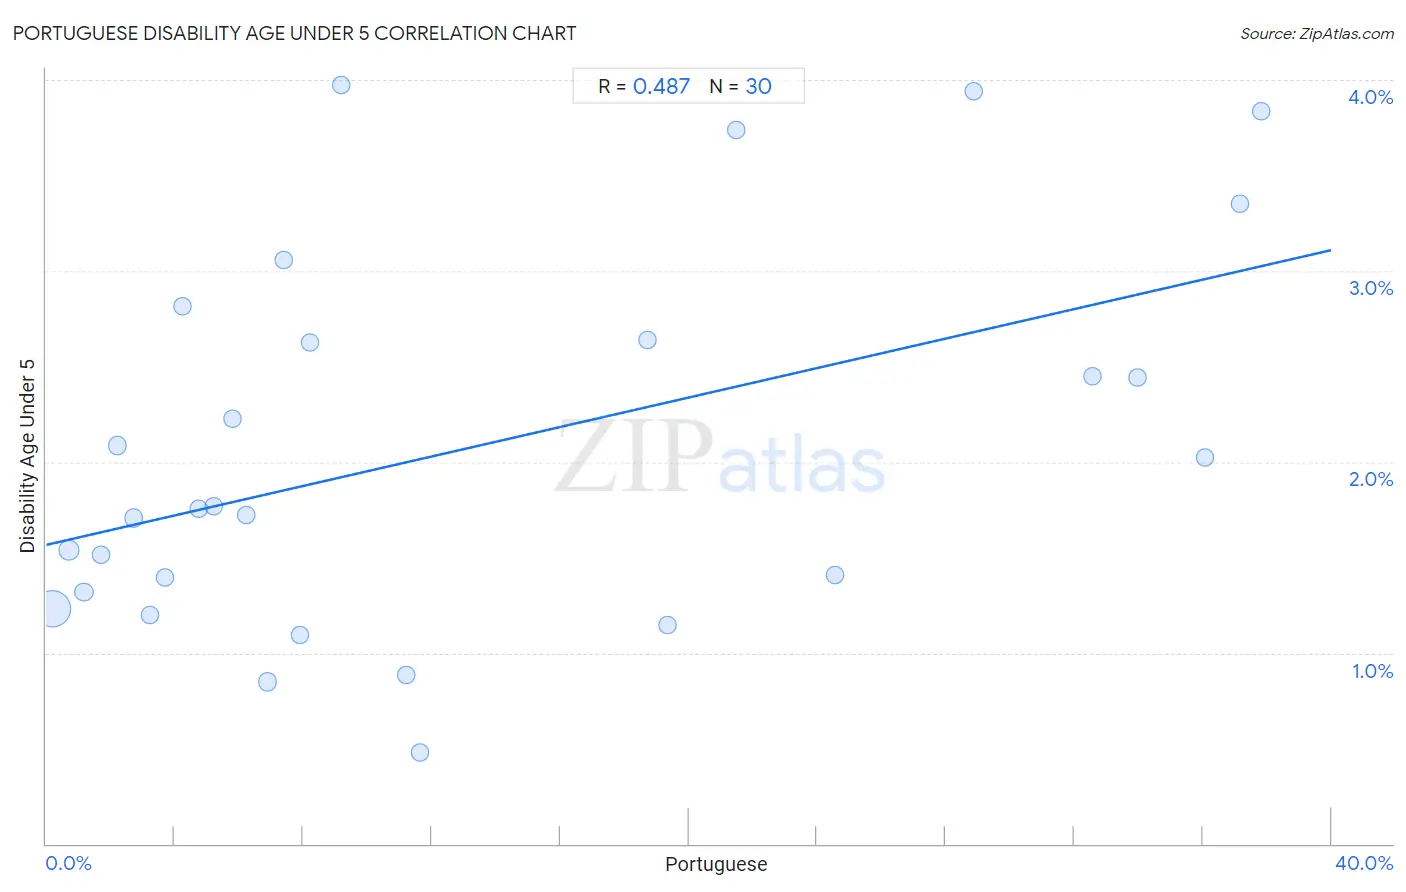
Portuguese Disability Age Under 5 Correlation Chart

The statistical analysis conducted on geographies consisting of 231,785,115 people shows a moderate positive correlation between the proportion of Portuguese and percentage of population with a disability under the age of 5 in the United States with a correlation coefficient (R) of 0.487 and weighted average of 1.6%. On average, for every 1% (one percent) increase in Portuguese within a typical geography, there is an increase of 0.039% in percentage of population with a disability under the age of 5.
Portuguese Disability Age Under 5
It is essential to understand that the correlation between the percentage of Portuguese and percentage of population with a disability under the age of 5 does not imply a direct cause-and-effect relationship. It remains uncertain whether the presence of Portuguese influences an upward or downward trend in the level of percentage of population with a disability under the age of 5 within an area, or if Portuguese simply ended up residing in those areas with higher or lower levels of percentage of population with a disability under the age of 5 due to other factors.

Demographics Similar to Portuguese by Disability Age Under 5

In terms of disability age under 5, the demographic groups most similar to Portuguese are Shoshone (1.6%, a difference of 0.33%), Cajun (1.6%, a difference of 0.57%), Nonimmigrants (1.6%, a difference of 0.58%), German Russian (1.6%, a difference of 0.78%), and Welsh (1.6%, a difference of 0.89%).
DemographicsRating | RankDisability Age Under 5
Italians
0.0
/100
|
#292
Tragic
1.6%
Lithuanians
0.0
/100
|
#293
Tragic
1.6%
Swedes
0.0
/100
|
#294
Tragic
1.6%
Finns
0.0
/100
|
#295
Tragic
1.6%
Poles
0.0
/100
|
#296
Tragic
1.6%
Nonimmigrants
0.0
/100
|
#297
Tragic
1.6%
Cajuns
0.0
/100
|
#298
Tragic
1.6%
Portuguese
0.0
/100
|
#299
Tragic
1.6%
Shoshone
0.0
/100
|
#300
Tragic
1.6%
German Russians
0.0
/100
|
#301
Tragic
1.6%
Welsh
0.0
/100
|
#302
Tragic
1.6%
Swiss
0.0
/100
|
#303
Tragic
1.6%
Seminole
0.0
/100
|
#304
Tragic
1.6%
Blackfeet
0.0
/100
|
#305
Tragic
1.6%
Creek
0.0
/100
|
#306
Tragic
1.6%

Portuguese Disability Age Under 5 Correlation Summary

MeasurementPortuguese DataDisability Age Under 5 Data
Minimum0.18%0.48%
Maximum37.8%4.0%
Range37.7%3.5%
Mean13.2%2.1%
Median7.6%1.8%
Interquartile 25% (IQ1)3.7%1.3%
Interquartile 75% (IQ3)21.5%2.6%
Interquartile Range (IQR)17.8%1.3%
Standard Deviation (Sample)12.5%0.99%
Standard Deviation (Population)12.3%0.97%

Correlation Details

Portuguese PercentileSample SizeDisability Age Under 5
[
0.0%
-
0.5%
]
0.18%
189,229,8251.2%
[
0.5%
-
1.0%
]
0.70%
22,446,2811.5%
[
1.0%
-
1.5%
]
1.19%
8,812,0131.3%
[
1.5%
-
2.0%
]
1.71%
4,343,4721.5%
[
2.0%
-
2.5%
]
2.20%
2,301,3752.1%
[
2.5%
-
3.0%
]
2.74%
1,397,7981.7%
[
3.0%
-
3.5%
]
3.24%
821,0401.2%
[
3.5%
-
4.0%
]
3.71%
220,6401.4%
[
4.0%
-
4.5%
]
4.23%
185,5372.8%
[
4.5%
-
5.0%
]
4.77%
267,8881.8%
[
5.0%
-
5.5%
]
5.21%
134,2891.8%
[
5.5%
-
6.0%
]
5.78%
332,7582.2%
[
6.0%
-
6.5%
]
6.22%
155,8581.7%
[
6.5%
-
7.0%
]
6.87%
248,0660.85%
[
7.0%
-
7.5%
]
7.41%
48,9173.1%
[
7.5%
-
8.0%
]
7.89%
177,3921.1%
[
8.0%
-
8.5%
]
8.19%
59,3952.6%
[
9.0%
-
9.5%
]
9.17%
36,2754.0%
[
11.0%
-
11.5%
]
11.19%
11,6250.89%
[
11.5%
-
12.0%
]
11.64%
56,6960.48%
[
18.5%
-
19.0%
]
18.73%
81,8562.6%
[
19.0%
-
19.5%
]
19.35%
51,9151.1%
[
21.0%
-
21.5%
]
21.48%
20,8833.7%
[
24.5%
-
25.0%
]
24.56%
16,2861.4%
[
28.5%
-
29.0%
]
28.88%
62,9473.9%
[
32.5%
-
33.0%
]
32.57%
100,6202.4%
[
33.5%
-
34.0%
]
33.98%
12,4652.4%
[
36.0%
-
36.5%
]
36.09%
93,6382.0%
[
37.0%
-
37.5%
]
37.17%
26,8073.4%
[
37.5%
-
38.0%
]
37.83%
30,5583.8%