Portuguese College, 1 year or more
COMPARE
Portuguese
Select to Compare
College, 1 year or more
Portuguese College, 1 year or more
57.2%
COLLEGE, 1 YEAR OR MORE
5.4/ 100
METRIC RATING
223rd/ 347
METRIC RANK
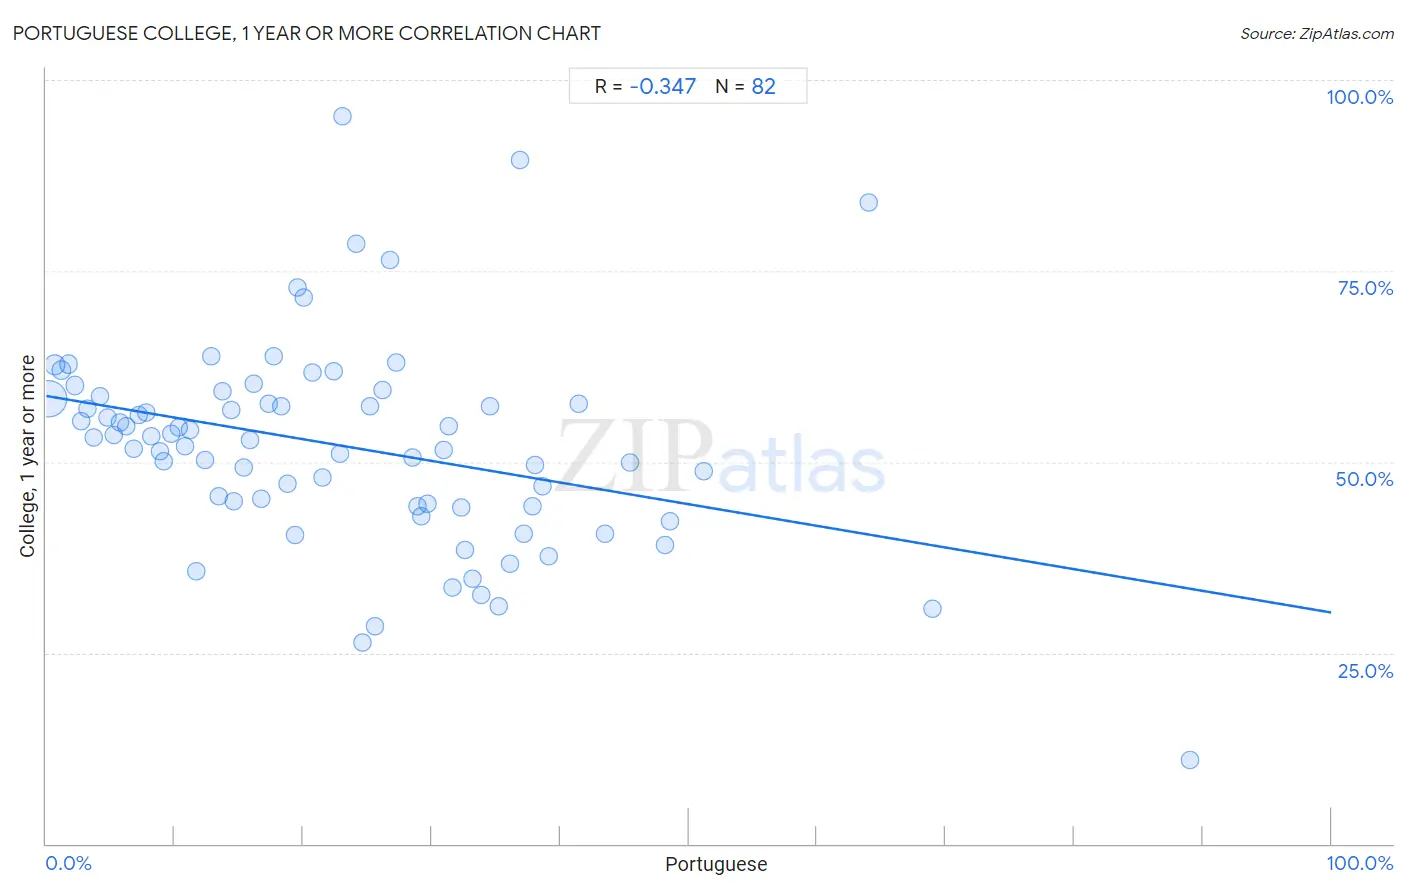
Portuguese College, 1 year or more Correlation Chart
The statistical analysis conducted on geographies consisting of 450,364,670 people shows a mild negative correlation between the proportion of Portuguese and percentage of population with at least college, 1 year or more education in the United States with a correlation coefficient (R) of -0.347 and weighted average of 57.2%. On average, for every 1% (one percent) increase in Portuguese within a typical geography, there is a decrease of 0.28% in percentage of population with at least college, 1 year or more education.
It is essential to understand that the correlation between the percentage of Portuguese and percentage of population with at least college, 1 year or more education does not imply a direct cause-and-effect relationship. It remains uncertain whether the presence of Portuguese influences an upward or downward trend in the level of percentage of population with at least college, 1 year or more education within an area, or if Portuguese simply ended up residing in those areas with higher or lower levels of percentage of population with at least college, 1 year or more education due to other factors.
Demographics Similar to Portuguese by College, 1 year or more
In terms of college, 1 year or more, the demographic groups most similar to Portuguese are Hmong (57.2%, a difference of 0.0%), Subsaharan African (57.3%, a difference of 0.17%), Vietnamese (57.0%, a difference of 0.21%), Immigrants from Western Africa (57.0%, a difference of 0.23%), and Immigrants (57.0%, a difference of 0.30%).
| Demographics | Rating | Rank | College, 1 year or more |
| Immigrants from Peru | 10.6 /100 | #216 | Poor 57.7% |
| Immigrants from Panama | 9.1 /100 | #217 | Tragic 57.6% |
| Native Hawaiians | 9.0 /100 | #218 | Tragic 57.6% |
| Whites/Caucasians | 8.7 /100 | #219 | Tragic 57.6% |
| Immigrants from Costa Rica | 8.0 /100 | #220 | Tragic 57.5% |
| Immigrants from Ghana | 7.7 /100 | #221 | Tragic 57.4% |
| Sub-Saharan Africans | 6.1 /100 | #222 | Tragic 57.3% |
| Portuguese | 5.4 /100 | #223 | Tragic 57.2% |
| Hmong | 5.4 /100 | #224 | Tragic 57.2% |
| Vietnamese | 4.7 /100 | #225 | Tragic 57.0% |
| Immigrants from Western Africa | 4.6 /100 | #226 | Tragic 57.0% |
| Immigrants | 4.4 /100 | #227 | Tragic 57.0% |
| Immigrants from Fiji | 4.0 /100 | #228 | Tragic 56.9% |
| Cree | 3.6 /100 | #229 | Tragic 56.8% |
| Liberians | 3.1 /100 | #230 | Tragic 56.7% |
Portuguese College, 1 year or more Correlation Summary
| Measurement | Portuguese Data | College, 1 year or more Data |
| Minimum | 0.18% | 11.0% |
| Maximum | 89.0% | 95.3% |
| Range | 88.9% | 84.4% |
| Mean | 23.0% | 52.1% |
| Median | 20.4% | 53.0% |
| Interquartile 25% (IQ1) | 10.3% | 44.2% |
| Interquartile 75% (IQ3) | 32.6% | 58.2% |
| Interquartile Range (IQR) | 22.3% | 14.0% |
| Standard Deviation (Sample) | 16.6% | 13.6% |
| Standard Deviation (Population) | 16.5% | 13.5% |
Correlation Details
| Portuguese Percentile | Sample Size | College, 1 year or more |
[ 0.0% - 0.5% ] 0.18% | 348,346,569 | 58.2% |
[ 0.5% - 1.0% ] 0.70% | 53,669,589 | 62.7% |
[ 1.0% - 1.5% ] 1.20% | 19,774,035 | 62.0% |
[ 1.5% - 2.0% ] 1.72% | 10,125,046 | 62.8% |
[ 2.0% - 2.5% ] 2.22% | 5,477,912 | 60.0% |
[ 2.5% - 3.0% ] 2.74% | 2,808,155 | 55.3% |
[ 3.0% - 3.5% ] 3.25% | 2,441,959 | 57.0% |
[ 3.5% - 4.0% ] 3.73% | 1,399,136 | 53.1% |
[ 4.0% - 4.5% ] 4.21% | 722,639 | 58.7% |
[ 4.5% - 5.0% ] 4.74% | 847,514 | 55.7% |
[ 5.0% - 5.5% ] 5.23% | 673,472 | 53.5% |
[ 5.5% - 6.0% ] 5.74% | 752,995 | 55.1% |
[ 6.0% - 6.5% ] 6.21% | 425,441 | 54.7% |
[ 6.5% - 7.0% ] 6.78% | 394,303 | 51.7% |
[ 7.0% - 7.5% ] 7.22% | 255,719 | 56.1% |
[ 7.5% - 8.0% ] 7.81% | 363,245 | 56.5% |
[ 8.0% - 8.5% ] 8.19% | 119,887 | 53.3% |
[ 8.5% - 9.0% ] 8.83% | 142,227 | 51.4% |
[ 9.0% - 9.5% ] 9.17% | 142,419 | 50.1% |
[ 9.5% - 10.0% ] 9.75% | 141,032 | 53.7% |
[ 10.0% - 10.5% ] 10.30% | 15,477 | 54.5% |
[ 10.5% - 11.0% ] 10.79% | 61,532 | 52.0% |
[ 11.0% - 11.5% ] 11.22% | 73,198 | 54.2% |
[ 11.5% - 12.0% ] 11.70% | 125,289 | 35.7% |
[ 12.0% - 12.5% ] 12.31% | 20,468 | 50.3% |
[ 12.5% - 13.0% ] 12.85% | 33,616 | 63.9% |
[ 13.0% - 13.5% ] 13.44% | 18,931 | 45.6% |
[ 13.5% - 14.0% ] 13.76% | 25,916 | 59.2% |
[ 14.0% - 14.5% ] 14.37% | 6,401 | 56.8% |
[ 14.5% - 15.0% ] 14.57% | 2,868 | 44.8% |
[ 15.0% - 15.5% ] 15.33% | 7,833 | 49.3% |
[ 15.5% - 16.0% ] 15.81% | 6,475 | 52.8% |
[ 16.0% - 16.5% ] 16.19% | 9,009 | 60.2% |
[ 16.5% - 17.0% ] 16.74% | 19,746 | 45.1% |
[ 17.0% - 17.5% ] 17.31% | 104 | 57.7% |
[ 17.5% - 18.0% ] 17.73% | 141 | 63.8% |
[ 18.0% - 18.5% ] 18.26% | 40,467 | 57.3% |
[ 18.5% - 19.0% ] 18.73% | 82,595 | 47.1% |
[ 19.0% - 19.5% ] 19.35% | 54,661 | 40.5% |
[ 19.5% - 20.0% ] 19.59% | 5,231 | 72.8% |
[ 20.0% - 20.5% ] 20.04% | 6,810 | 71.6% |
[ 20.5% - 21.0% ] 20.72% | 1,699 | 61.7% |
[ 21.0% - 21.5% ] 21.48% | 20,883 | 47.9% |
[ 22.0% - 22.5% ] 22.36% | 13,232 | 61.8% |
[ 22.5% - 23.0% ] 22.84% | 52,833 | 51.1% |
[ 23.0% - 23.5% ] 23.06% | 360 | 95.3% |
[ 24.0% - 24.5% ] 24.10% | 249 | 78.5% |
[ 24.5% - 25.0% ] 24.56% | 16,346 | 26.3% |
[ 25.0% - 25.5% ] 25.16% | 4,463 | 57.2% |
[ 25.5% - 26.0% ] 25.59% | 1,399 | 28.5% |
[ 26.0% - 26.5% ] 26.17% | 10,792 | 59.4% |
[ 26.5% - 27.0% ] 26.79% | 474 | 76.5% |
[ 27.0% - 27.5% ] 27.23% | 7,592 | 63.0% |
[ 28.0% - 28.5% ] 28.50% | 11,117 | 50.5% |
[ 28.5% - 29.0% ] 28.88% | 63,645 | 44.2% |
[ 29.0% - 29.5% ] 29.14% | 21,742 | 42.8% |
[ 29.5% - 30.0% ] 29.63% | 54 | 44.4% |
[ 30.5% - 31.0% ] 30.91% | 495 | 51.5% |
[ 31.0% - 31.5% ] 31.35% | 50,396 | 54.7% |
[ 31.5% - 32.0% ] 31.65% | 18,810 | 33.5% |
[ 32.0% - 32.5% ] 32.30% | 10,466 | 44.0% |
[ 32.5% - 33.0% ] 32.62% | 120,280 | 38.5% |
[ 33.0% - 33.5% ] 33.21% | 8,763 | 34.7% |
[ 33.5% - 34.0% ] 33.89% | 15,718 | 32.6% |
[ 34.5% - 35.0% ] 34.52% | 8,403 | 57.2% |
[ 35.0% - 35.5% ] 35.22% | 17,164 | 31.1% |
[ 36.0% - 36.5% ] 36.09% | 93,789 | 36.7% |
[ 36.5% - 37.0% ] 36.84% | 19 | 89.5% |
[ 37.0% - 37.5% ] 37.20% | 43,238 | 40.7% |
[ 37.5% - 38.0% ] 37.83% | 30,558 | 44.2% |
[ 38.0% - 38.5% ] 38.05% | 21,383 | 49.6% |
[ 38.5% - 39.0% ] 38.59% | 4,556 | 46.8% |
[ 39.0% - 39.5% ] 39.14% | 6,545 | 37.6% |
[ 41.0% - 41.5% ] 41.44% | 11,431 | 57.6% |
[ 43.0% - 43.5% ] 43.45% | 25,084 | 40.6% |
[ 45.0% - 45.5% ] 45.45% | 22 | 50.0% |
[ 48.0% - 48.5% ] 48.18% | 4,660 | 39.1% |
[ 48.5% - 49.0% ] 48.56% | 5,591 | 42.2% |
[ 51.0% - 51.5% ] 51.18% | 127 | 48.8% |
[ 64.0% - 64.5% ] 64.00% | 25 | 84.0% |
[ 68.5% - 69.0% ] 68.94% | 132 | 30.9% |
[ 89.0% - 89.5% ] 89.04% | 73 | 11.0% |