Cajun College, 1 year or more
COMPARE
Cajun
Select to Compare
College, 1 year or more
Cajun College, 1 year or more
51.2%
COLLEGE, 1 YEAR OR MORE
0.0/ 100
METRIC RATING
316th/ 347
METRIC RANK
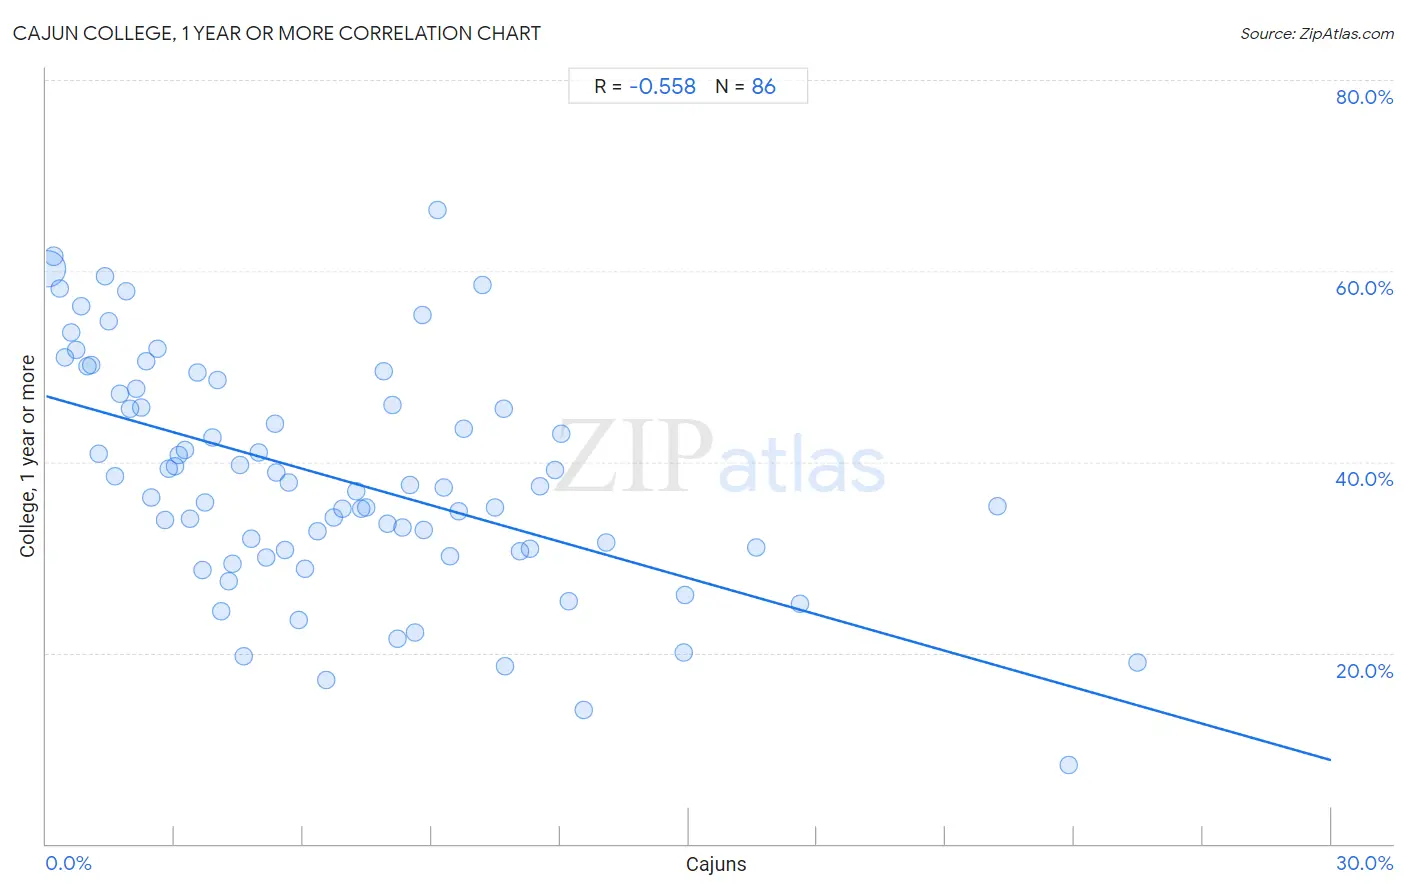
Cajun College, 1 year or more Correlation Chart
The statistical analysis conducted on geographies consisting of 149,712,775 people shows a substantial negative correlation between the proportion of Cajuns and percentage of population with at least college, 1 year or more education in the United States with a correlation coefficient (R) of -0.558 and weighted average of 51.2%. On average, for every 1% (one percent) increase in Cajuns within a typical geography, there is a decrease of 1.3% in percentage of population with at least college, 1 year or more education.
It is essential to understand that the correlation between the percentage of Cajuns and percentage of population with at least college, 1 year or more education does not imply a direct cause-and-effect relationship. It remains uncertain whether the presence of Cajuns influences an upward or downward trend in the level of percentage of population with at least college, 1 year or more education within an area, or if Cajuns simply ended up residing in those areas with higher or lower levels of percentage of population with at least college, 1 year or more education due to other factors.
Demographics Similar to Cajuns by College, 1 year or more
In terms of college, 1 year or more, the demographic groups most similar to Cajuns are Guatemalan (51.2%, a difference of 0.070%), Hispanic or Latino (51.1%, a difference of 0.090%), Immigrants from Honduras (51.0%, a difference of 0.22%), Fijian (51.3%, a difference of 0.30%), and Immigrants from El Salvador (51.0%, a difference of 0.31%).
| Demographics | Rating | Rank | College, 1 year or more |
| Apache | 0.0 /100 | #309 | Tragic 51.8% |
| Hondurans | 0.0 /100 | #310 | Tragic 51.6% |
| Immigrants from Haiti | 0.0 /100 | #311 | Tragic 51.5% |
| Pueblo | 0.0 /100 | #312 | Tragic 51.5% |
| Immigrants from Caribbean | 0.0 /100 | #313 | Tragic 51.4% |
| Fijians | 0.0 /100 | #314 | Tragic 51.3% |
| Guatemalans | 0.0 /100 | #315 | Tragic 51.2% |
| Cajuns | 0.0 /100 | #316 | Tragic 51.2% |
| Hispanics or Latinos | 0.0 /100 | #317 | Tragic 51.1% |
| Immigrants from Honduras | 0.0 /100 | #318 | Tragic 51.0% |
| Immigrants from El Salvador | 0.0 /100 | #319 | Tragic 51.0% |
| Kiowa | 0.0 /100 | #320 | Tragic 51.0% |
| Hopi | 0.0 /100 | #321 | Tragic 50.9% |
| Navajo | 0.0 /100 | #322 | Tragic 50.8% |
| Immigrants from Guatemala | 0.0 /100 | #323 | Tragic 50.7% |
Cajun College, 1 year or more Correlation Summary
| Measurement | Cajun Data | College, 1 year or more Data |
| Minimum | 0.029% | 8.2% |
| Maximum | 25.5% | 66.4% |
| Range | 25.4% | 58.2% |
| Mean | 6.7% | 38.3% |
| Median | 5.6% | 37.4% |
| Interquartile 25% (IQ1) | 2.8% | 30.8% |
| Interquartile 75% (IQ3) | 9.4% | 47.1% |
| Interquartile Range (IQR) | 6.7% | 16.3% |
| Standard Deviation (Sample) | 5.3% | 12.0% |
| Standard Deviation (Population) | 5.2% | 11.9% |
Correlation Details
| Cajun Percentile | Sample Size | College, 1 year or more |
[ 0.0% - 0.5% ] 0.029% | 130,752,319 | 60.2% |
[ 0.0% - 0.5% ] 0.18% | 9,197,021 | 61.5% |
[ 0.0% - 0.5% ] 0.31% | 3,479,452 | 58.2% |
[ 0.0% - 0.5% ] 0.44% | 1,251,796 | 51.0% |
[ 0.5% - 1.0% ] 0.57% | 871,087 | 53.6% |
[ 0.5% - 1.0% ] 0.69% | 686,310 | 51.8% |
[ 0.5% - 1.0% ] 0.81% | 509,497 | 56.3% |
[ 0.5% - 1.0% ] 0.96% | 388,772 | 50.0% |
[ 1.0% - 1.5% ] 1.06% | 349,044 | 50.2% |
[ 1.0% - 1.5% ] 1.21% | 156,759 | 40.8% |
[ 1.0% - 1.5% ] 1.36% | 141,030 | 59.5% |
[ 1.0% - 1.5% ] 1.47% | 174,374 | 54.8% |
[ 1.5% - 2.0% ] 1.61% | 127,638 | 38.5% |
[ 1.5% - 2.0% ] 1.71% | 102,631 | 47.1% |
[ 1.5% - 2.0% ] 1.86% | 154,972 | 57.8% |
[ 1.5% - 2.0% ] 1.96% | 179,271 | 45.5% |
[ 2.0% - 2.5% ] 2.09% | 132,222 | 47.7% |
[ 2.0% - 2.5% ] 2.22% | 46,990 | 45.8% |
[ 2.0% - 2.5% ] 2.33% | 70,844 | 50.6% |
[ 2.0% - 2.5% ] 2.46% | 79,335 | 36.3% |
[ 2.5% - 3.0% ] 2.61% | 116,910 | 51.8% |
[ 2.5% - 3.0% ] 2.77% | 54,387 | 33.9% |
[ 2.5% - 3.0% ] 2.86% | 8,422 | 39.2% |
[ 3.0% - 3.5% ] 3.01% | 39,547 | 39.6% |
[ 3.0% - 3.5% ] 3.09% | 100,522 | 40.7% |
[ 3.0% - 3.5% ] 3.23% | 121,203 | 41.3% |
[ 3.0% - 3.5% ] 3.37% | 60,216 | 34.1% |
[ 3.5% - 4.0% ] 3.53% | 538 | 49.3% |
[ 3.5% - 4.0% ] 3.64% | 6,211 | 28.7% |
[ 3.5% - 4.0% ] 3.71% | 18,577 | 35.8% |
[ 3.5% - 4.0% ] 3.89% | 3,417 | 42.6% |
[ 4.0% - 4.5% ] 4.01% | 31,642 | 48.5% |
[ 4.0% - 4.5% ] 4.10% | 122 | 24.4% |
[ 4.0% - 4.5% ] 4.25% | 6,498 | 27.5% |
[ 4.0% - 4.5% ] 4.36% | 734 | 29.3% |
[ 4.5% - 5.0% ] 4.51% | 27,050 | 39.6% |
[ 4.5% - 5.0% ] 4.61% | 3,794 | 19.7% |
[ 4.5% - 5.0% ] 4.79% | 13,079 | 31.9% |
[ 4.5% - 5.0% ] 4.96% | 6,507 | 41.0% |
[ 5.0% - 5.5% ] 5.13% | 19,497 | 29.9% |
[ 5.0% - 5.5% ] 5.34% | 8,858 | 44.0% |
[ 5.0% - 5.5% ] 5.38% | 2,474 | 38.9% |
[ 5.5% - 6.0% ] 5.56% | 5,108 | 30.8% |
[ 5.5% - 6.0% ] 5.66% | 7,665 | 37.8% |
[ 5.5% - 6.0% ] 5.89% | 7,606 | 23.4% |
[ 6.0% - 6.5% ] 6.03% | 9,639 | 28.8% |
[ 6.0% - 6.5% ] 6.33% | 8,061 | 32.7% |
[ 6.5% - 7.0% ] 6.55% | 229 | 17.2% |
[ 6.5% - 7.0% ] 6.72% | 16,937 | 34.1% |
[ 6.5% - 7.0% ] 6.90% | 9,823 | 35.1% |
[ 7.0% - 7.5% ] 7.22% | 12,059 | 37.0% |
[ 7.0% - 7.5% ] 7.34% | 31,076 | 35.1% |
[ 7.0% - 7.5% ] 7.47% | 5,579 | 35.2% |
[ 7.5% - 8.0% ] 7.88% | 2,437 | 49.5% |
[ 7.5% - 8.0% ] 7.96% | 1,659 | 33.6% |
[ 8.0% - 8.5% ] 8.09% | 5,528 | 46.0% |
[ 8.0% - 8.5% ] 8.21% | 134 | 21.4% |
[ 8.0% - 8.5% ] 8.32% | 2,633 | 33.2% |
[ 8.5% - 9.0% ] 8.50% | 13,329 | 37.5% |
[ 8.5% - 9.0% ] 8.60% | 2,023 | 22.2% |
[ 8.5% - 9.0% ] 8.78% | 1,766 | 55.4% |
[ 8.5% - 9.0% ] 8.81% | 885 | 32.9% |
[ 9.0% - 9.5% ] 9.13% | 241 | 66.4% |
[ 9.0% - 9.5% ] 9.29% | 915 | 37.3% |
[ 9.0% - 9.5% ] 9.43% | 23,891 | 30.2% |
[ 9.5% - 10.0% ] 9.64% | 1,473 | 34.8% |
[ 9.5% - 10.0% ] 9.76% | 1,445 | 43.4% |
[ 10.0% - 10.5% ] 10.18% | 855 | 58.5% |
[ 10.0% - 10.5% ] 10.47% | 1,518 | 35.2% |
[ 10.5% - 11.0% ] 10.69% | 8,271 | 45.5% |
[ 10.5% - 11.0% ] 10.71% | 1,223 | 18.5% |
[ 11.0% - 11.5% ] 11.06% | 5,423 | 30.7% |
[ 11.0% - 11.5% ] 11.29% | 62 | 30.9% |
[ 11.5% - 12.0% ] 11.52% | 191 | 37.4% |
[ 11.5% - 12.0% ] 11.87% | 691 | 39.1% |
[ 12.0% - 12.5% ] 12.01% | 2,215 | 43.0% |
[ 12.0% - 12.5% ] 12.21% | 860 | 25.4% |
[ 12.5% - 13.0% ] 12.55% | 1,147 | 14.0% |
[ 13.0% - 13.5% ] 13.06% | 9,326 | 31.5% |
[ 14.5% - 15.0% ] 14.89% | 47 | 20.0% |
[ 14.5% - 15.0% ] 14.92% | 1,220 | 26.1% |
[ 16.5% - 17.0% ] 16.57% | 3,754 | 31.1% |
[ 17.5% - 18.0% ] 17.59% | 216 | 25.2% |
[ 22.0% - 22.5% ] 22.22% | 207 | 35.4% |
[ 23.5% - 24.0% ] 23.87% | 398 | 8.2% |
[ 25.0% - 25.5% ] 25.47% | 1,441 | 19.0% |