Cajun Married-Couple Family Poverty
COMPARE
Cajun
Select to Compare
Married-Couple Family Poverty
Cajun Married-Couple Family Poverty
5.6%
POVERTY | MARRIED-COUPLE FAMILIES
6.9/ 100
METRIC RATING
222nd/ 347
METRIC RANK
Cajun Married-Couple Family Poverty Correlation Chart
The statistical analysis conducted on geographies consisting of 149,203,084 people shows a mild positive correlation between the proportion of Cajuns and poverty level among married-couple families in the United States with a correlation coefficient (R) of 0.349 and weighted average of 5.6%. On average, for every 1% (one percent) increase in Cajuns within a typical geography, there is an increase of 0.40% in poverty level among married-couple families.
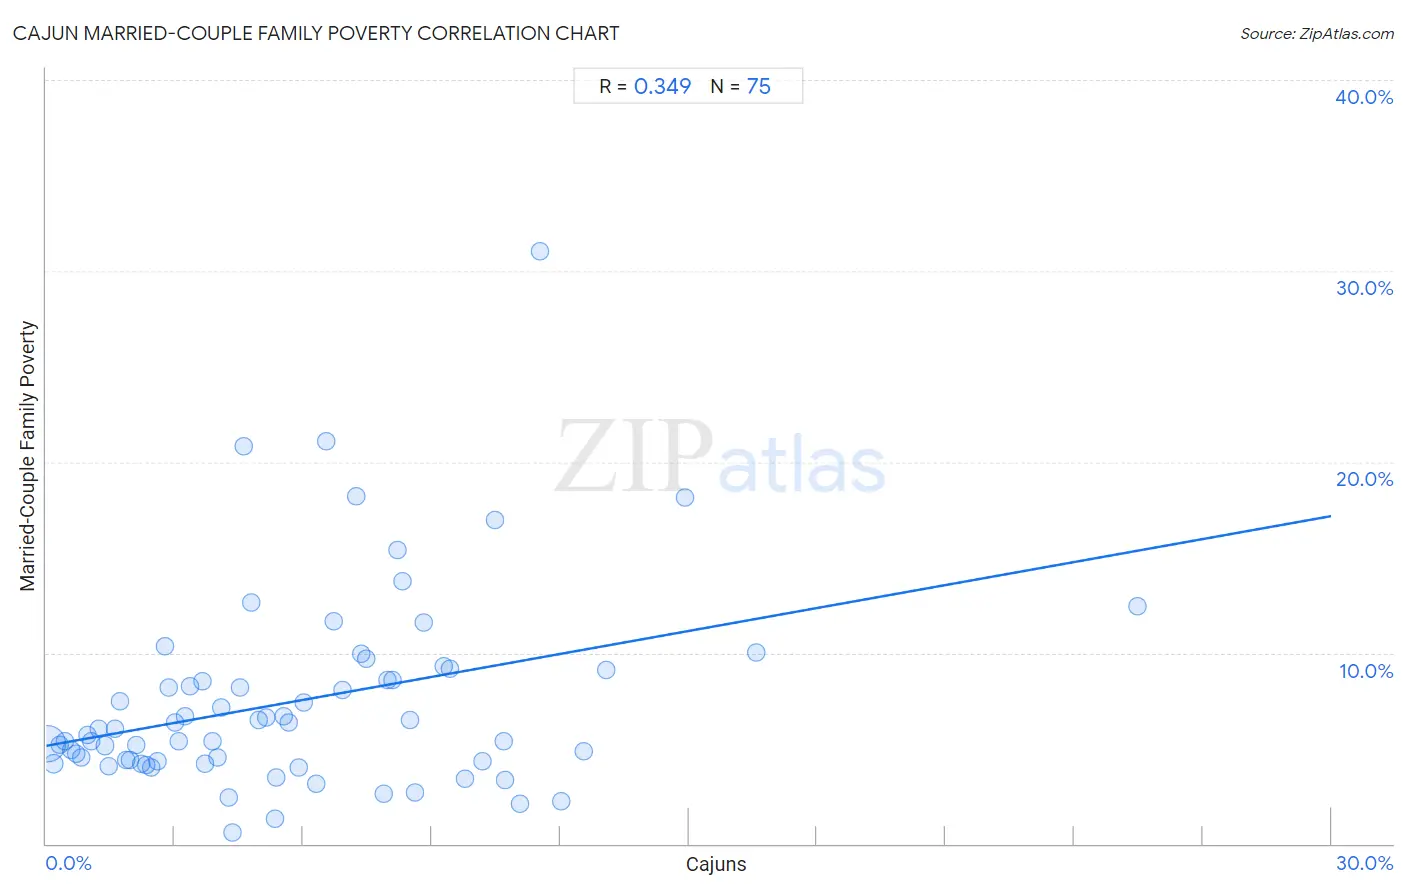
It is essential to understand that the correlation between the percentage of Cajuns and poverty level among married-couple families does not imply a direct cause-and-effect relationship. It remains uncertain whether the presence of Cajuns influences an upward or downward trend in the level of poverty level among married-couple families within an area, or if Cajuns simply ended up residing in those areas with higher or lower levels of poverty level among married-couple families due to other factors.
Demographics Similar to Cajuns by Married-Couple Family Poverty
In terms of married-couple family poverty, the demographic groups most similar to Cajuns are Immigrants from Fiji (5.6%, a difference of 0.070%), Sudanese (5.6%, a difference of 0.18%), Immigrants from Cambodia (5.6%, a difference of 0.32%), South American (5.6%, a difference of 0.55%), and Immigrants from Zaire (5.6%, a difference of 0.56%).
| Demographics | Rating | Rank | Married-Couple Family Poverty |
| Armenians | 12.8 /100 | #215 | Poor 5.5% |
| Potawatomi | 12.4 /100 | #216 | Poor 5.5% |
| Immigrants from Nigeria | 11.3 /100 | #217 | Poor 5.5% |
| Afghans | 11.2 /100 | #218 | Poor 5.5% |
| Japanese | 9.8 /100 | #219 | Tragic 5.6% |
| Colombians | 9.2 /100 | #220 | Tragic 5.6% |
| Panamanians | 9.2 /100 | #221 | Tragic 5.6% |
| Cajuns | 6.9 /100 | #222 | Tragic 5.6% |
| Immigrants from Fiji | 6.7 /100 | #223 | Tragic 5.6% |
| Sudanese | 6.4 /100 | #224 | Tragic 5.6% |
| Immigrants from Cambodia | 6.1 /100 | #225 | Tragic 5.6% |
| South Americans | 5.7 /100 | #226 | Tragic 5.6% |
| Immigrants from Zaire | 5.6 /100 | #227 | Tragic 5.6% |
| Arabs | 5.4 /100 | #228 | Tragic 5.7% |
| Sub-Saharan Africans | 4.9 /100 | #229 | Tragic 5.7% |
Cajun Married-Couple Family Poverty Correlation Summary
| Measurement | Cajun Data | Married-Couple Family Poverty Data |
| Minimum | 0.029% | 0.57% |
| Maximum | 25.5% | 31.0% |
| Range | 25.4% | 30.5% |
| Mean | 5.8% | 7.5% |
| Median | 5.0% | 6.0% |
| Interquartile 25% (IQ1) | 2.3% | 4.3% |
| Interquartile 75% (IQ3) | 8.3% | 9.1% |
| Interquartile Range (IQR) | 6.0% | 4.8% |
| Standard Deviation (Sample) | 4.5% | 5.1% |
| Standard Deviation (Population) | 4.4% | 5.1% |
Correlation Details
| Cajun Percentile | Sample Size | Married-Couple Family Poverty |
[ 0.0% - 0.5% ] 0.029% | 130,605,250 | 5.2% |
[ 0.0% - 0.5% ] 0.18% | 9,115,564 | 4.2% |
[ 0.0% - 0.5% ] 0.31% | 3,392,187 | 5.2% |
[ 0.0% - 0.5% ] 0.44% | 1,205,549 | 5.4% |
[ 0.5% - 1.0% ] 0.57% | 841,605 | 4.9% |
[ 0.5% - 1.0% ] 0.69% | 675,645 | 4.7% |
[ 0.5% - 1.0% ] 0.81% | 486,952 | 4.5% |
[ 0.5% - 1.0% ] 0.96% | 371,393 | 5.7% |
[ 1.0% - 1.5% ] 1.06% | 343,707 | 5.4% |
[ 1.0% - 1.5% ] 1.21% | 150,471 | 6.0% |
[ 1.0% - 1.5% ] 1.36% | 138,015 | 5.1% |
[ 1.0% - 1.5% ] 1.47% | 171,350 | 4.0% |
[ 1.5% - 2.0% ] 1.61% | 126,874 | 6.0% |
[ 1.5% - 2.0% ] 1.71% | 101,493 | 7.5% |
[ 1.5% - 2.0% ] 1.86% | 152,952 | 4.4% |
[ 1.5% - 2.0% ] 1.96% | 178,801 | 4.4% |
[ 2.0% - 2.5% ] 2.09% | 131,936 | 5.2% |
[ 2.0% - 2.5% ] 2.22% | 46,990 | 4.2% |
[ 2.0% - 2.5% ] 2.33% | 70,844 | 4.1% |
[ 2.0% - 2.5% ] 2.47% | 67,451 | 4.0% |
[ 2.5% - 3.0% ] 2.61% | 114,508 | 4.3% |
[ 2.5% - 3.0% ] 2.77% | 54,387 | 10.4% |
[ 2.5% - 3.0% ] 2.86% | 8,422 | 8.2% |
[ 3.0% - 3.5% ] 3.01% | 38,178 | 6.4% |
[ 3.0% - 3.5% ] 3.09% | 100,522 | 5.4% |
[ 3.0% - 3.5% ] 3.23% | 117,306 | 6.7% |
[ 3.0% - 3.5% ] 3.37% | 59,647 | 8.2% |
[ 3.5% - 4.0% ] 3.64% | 6,020 | 8.5% |
[ 3.5% - 4.0% ] 3.70% | 16,526 | 4.2% |
[ 3.5% - 4.0% ] 3.89% | 3,417 | 5.4% |
[ 4.0% - 4.5% ] 4.01% | 31,165 | 4.5% |
[ 4.0% - 4.5% ] 4.10% | 122 | 7.1% |
[ 4.0% - 4.5% ] 4.25% | 6,498 | 2.4% |
[ 4.0% - 4.5% ] 4.36% | 734 | 0.57% |
[ 4.5% - 5.0% ] 4.51% | 27,050 | 8.2% |
[ 4.5% - 5.0% ] 4.61% | 3,794 | 20.8% |
[ 4.5% - 5.0% ] 4.80% | 8,919 | 12.6% |
[ 4.5% - 5.0% ] 4.97% | 2,880 | 6.5% |
[ 5.0% - 5.5% ] 5.13% | 19,497 | 6.6% |
[ 5.0% - 5.5% ] 5.34% | 8,858 | 1.3% |
[ 5.0% - 5.5% ] 5.38% | 2,474 | 3.5% |
[ 5.5% - 6.0% ] 5.55% | 4,162 | 6.7% |
[ 5.5% - 6.0% ] 5.66% | 7,665 | 6.4% |
[ 5.5% - 6.0% ] 5.89% | 7,606 | 4.0% |
[ 6.0% - 6.5% ] 6.02% | 7,223 | 7.4% |
[ 6.0% - 6.5% ] 6.32% | 6,094 | 3.2% |
[ 6.5% - 7.0% ] 6.55% | 229 | 21.1% |
[ 6.5% - 7.0% ] 6.72% | 16,937 | 11.7% |
[ 6.5% - 7.0% ] 6.90% | 9,823 | 8.0% |
[ 7.0% - 7.5% ] 7.22% | 12,059 | 18.2% |
[ 7.0% - 7.5% ] 7.34% | 30,530 | 9.9% |
[ 7.0% - 7.5% ] 7.47% | 5,579 | 9.7% |
[ 7.5% - 8.0% ] 7.88% | 2,437 | 2.6% |
[ 7.5% - 8.0% ] 7.95% | 1,144 | 8.6% |
[ 8.0% - 8.5% ] 8.09% | 4,881 | 8.6% |
[ 8.0% - 8.5% ] 8.21% | 134 | 15.4% |
[ 8.0% - 8.5% ] 8.32% | 2,633 | 13.8% |
[ 8.5% - 9.0% ] 8.50% | 13,329 | 6.5% |
[ 8.5% - 9.0% ] 8.60% | 1,546 | 2.7% |
[ 8.5% - 9.0% ] 8.81% | 885 | 11.6% |
[ 9.0% - 9.5% ] 9.29% | 915 | 9.3% |
[ 9.0% - 9.5% ] 9.43% | 23,891 | 9.2% |
[ 9.5% - 10.0% ] 9.78% | 1,022 | 3.4% |
[ 10.0% - 10.5% ] 10.18% | 855 | 4.3% |
[ 10.0% - 10.5% ] 10.47% | 1,518 | 16.9% |
[ 10.5% - 11.0% ] 10.69% | 8,271 | 5.3% |
[ 10.5% - 11.0% ] 10.71% | 1,046 | 3.4% |
[ 11.0% - 11.5% ] 11.06% | 5,423 | 2.1% |
[ 11.5% - 12.0% ] 11.52% | 191 | 31.0% |
[ 12.0% - 12.5% ] 12.01% | 2,215 | 2.2% |
[ 12.5% - 13.0% ] 12.55% | 1,147 | 4.8% |
[ 13.0% - 13.5% ] 13.06% | 9,326 | 9.1% |
[ 14.5% - 15.0% ] 14.92% | 1,220 | 18.1% |
[ 16.5% - 17.0% ] 16.57% | 3,754 | 10.0% |
[ 25.0% - 25.5% ] 25.47% | 1,441 | 12.4% |