Cajun Disability Age Under 5
COMPARE
Cajun
Select to Compare
Disability Age Under 5
Cajun Disability Age Under 5
1.6%
DISABILITY | AGE UNDER 5
0.0/ 100
METRIC RATING
298th/ 347
METRIC RANK
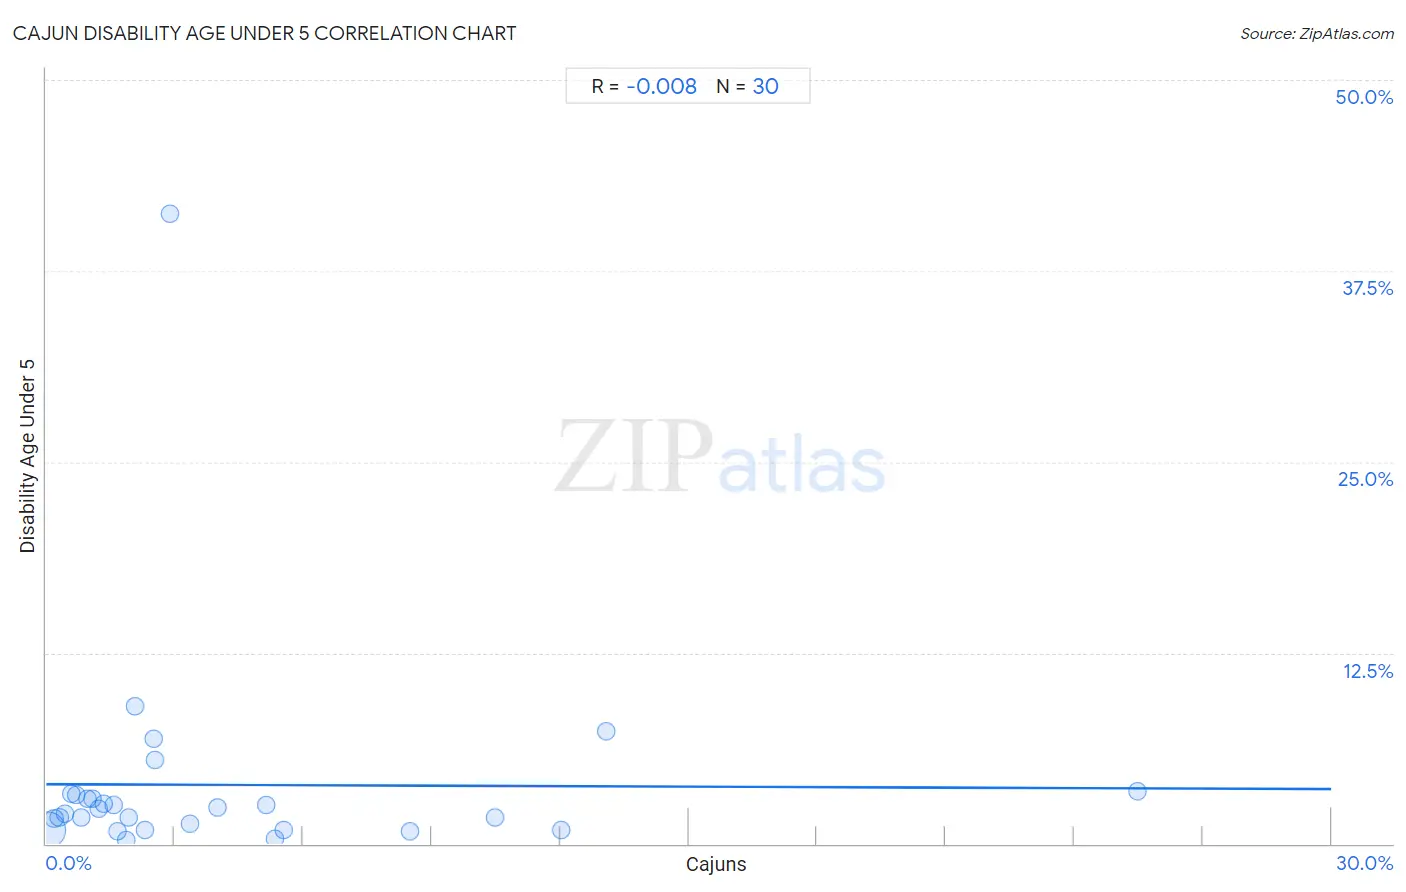
Cajun Disability Age Under 5 Correlation Chart
The statistical analysis conducted on geographies consisting of 103,694,895 people shows no correlation between the proportion of Cajuns and percentage of population with a disability under the age of 5 in the United States with a correlation coefficient (R) of -0.008 and weighted average of 1.6%. On average, for every 1% (one percent) increase in Cajuns within a typical geography, there is a decrease of 0.011% in percentage of population with a disability under the age of 5.
It is essential to understand that the correlation between the percentage of Cajuns and percentage of population with a disability under the age of 5 does not imply a direct cause-and-effect relationship. It remains uncertain whether the presence of Cajuns influences an upward or downward trend in the level of percentage of population with a disability under the age of 5 within an area, or if Cajuns simply ended up residing in those areas with higher or lower levels of percentage of population with a disability under the age of 5 due to other factors.
Demographics Similar to Cajuns by Disability Age Under 5
In terms of disability age under 5, the demographic groups most similar to Cajuns are Nonimmigrants (1.6%, a difference of 0.010%), Portuguese (1.6%, a difference of 0.57%), Shoshone (1.6%, a difference of 0.91%), Polish (1.6%, a difference of 0.96%), and Finnish (1.6%, a difference of 1.0%).
| Demographics | Rating | Rank | Disability Age Under 5 |
| Northern Europeans | 0.0 /100 | #291 | Tragic 1.6% |
| Italians | 0.0 /100 | #292 | Tragic 1.6% |
| Lithuanians | 0.0 /100 | #293 | Tragic 1.6% |
| Swedes | 0.0 /100 | #294 | Tragic 1.6% |
| Finns | 0.0 /100 | #295 | Tragic 1.6% |
| Poles | 0.0 /100 | #296 | Tragic 1.6% |
| Nonimmigrants | 0.0 /100 | #297 | Tragic 1.6% |
| Cajuns | 0.0 /100 | #298 | Tragic 1.6% |
| Portuguese | 0.0 /100 | #299 | Tragic 1.6% |
| Shoshone | 0.0 /100 | #300 | Tragic 1.6% |
| German Russians | 0.0 /100 | #301 | Tragic 1.6% |
| Welsh | 0.0 /100 | #302 | Tragic 1.6% |
| Swiss | 0.0 /100 | #303 | Tragic 1.6% |
| Seminole | 0.0 /100 | #304 | Tragic 1.6% |
| Blackfeet | 0.0 /100 | #305 | Tragic 1.6% |
Cajun Disability Age Under 5 Correlation Summary
| Measurement | Cajun Data | Disability Age Under 5 Data |
| Minimum | 0.023% | 0.26% |
| Maximum | 25.5% | 41.3% |
| Range | 25.4% | 41.0% |
| Mean | 4.0% | 3.9% |
| Median | 2.0% | 2.1% |
| Interquartile 25% (IQ1) | 0.95% | 0.93% |
| Interquartile 75% (IQ3) | 5.1% | 3.2% |
| Interquartile Range (IQR) | 4.2% | 2.3% |
| Standard Deviation (Sample) | 5.3% | 7.4% |
| Standard Deviation (Population) | 5.3% | 7.2% |
Correlation Details
| Cajun Percentile | Sample Size | Disability Age Under 5 |
[ 0.0% - 0.5% ] 0.023% | 98,180,523 | 0.93% |
[ 0.0% - 0.5% ] 0.18% | 2,659,081 | 1.7% |
[ 0.0% - 0.5% ] 0.30% | 1,207,752 | 1.7% |
[ 0.0% - 0.5% ] 0.43% | 487,628 | 2.0% |
[ 0.5% - 1.0% ] 0.57% | 96,912 | 3.3% |
[ 0.5% - 1.0% ] 0.70% | 194,142 | 3.2% |
[ 0.5% - 1.0% ] 0.80% | 187,380 | 1.7% |
[ 0.5% - 1.0% ] 0.95% | 78,963 | 2.9% |
[ 1.0% - 1.5% ] 1.07% | 71,954 | 2.9% |
[ 1.0% - 1.5% ] 1.22% | 98,155 | 2.3% |
[ 1.0% - 1.5% ] 1.35% | 42,294 | 2.6% |
[ 1.5% - 2.0% ] 1.58% | 21,142 | 2.6% |
[ 1.5% - 2.0% ] 1.66% | 28,165 | 0.79% |
[ 1.5% - 2.0% ] 1.86% | 122,757 | 0.26% |
[ 1.5% - 2.0% ] 1.93% | 85,040 | 1.8% |
[ 2.0% - 2.5% ] 2.08% | 4,377 | 9.0% |
[ 2.0% - 2.5% ] 2.31% | 19,195 | 0.89% |
[ 2.5% - 3.0% ] 2.51% | 5,410 | 6.8% |
[ 2.5% - 3.0% ] 2.55% | 11,804 | 5.5% |
[ 2.5% - 3.0% ] 2.90% | 1,103 | 41.3% |
[ 3.0% - 3.5% ] 3.35% | 28,363 | 1.3% |
[ 4.0% - 4.5% ] 4.00% | 2,522 | 2.3% |
[ 5.0% - 5.5% ] 5.13% | 19,497 | 2.5% |
[ 5.0% - 5.5% ] 5.34% | 8,745 | 0.35% |
[ 5.5% - 6.0% ] 5.55% | 4,162 | 0.90% |
[ 8.5% - 9.0% ] 8.50% | 13,329 | 0.80% |
[ 10.0% - 10.5% ] 10.47% | 1,518 | 1.7% |
[ 12.0% - 12.5% ] 12.01% | 2,215 | 0.88% |
[ 13.0% - 13.5% ] 13.06% | 9,326 | 7.4% |
[ 25.0% - 25.5% ] 25.47% | 1,441 | 3.5% |