Cajun Unemployment Among Women with Children Ages 6 to 17 years
COMPARE
Cajun
Select to Compare
Unemployment Among Women with Children Ages 6 to 17 years
Cajun Unemployment Among Women with Children Ages 6 to 17 years
10.8%
UNEMPLOYMENT | WOMEN W/ CHILDREN 6 TO 17
0.0/ 100
METRIC RATING
325th/ 347
METRIC RANK
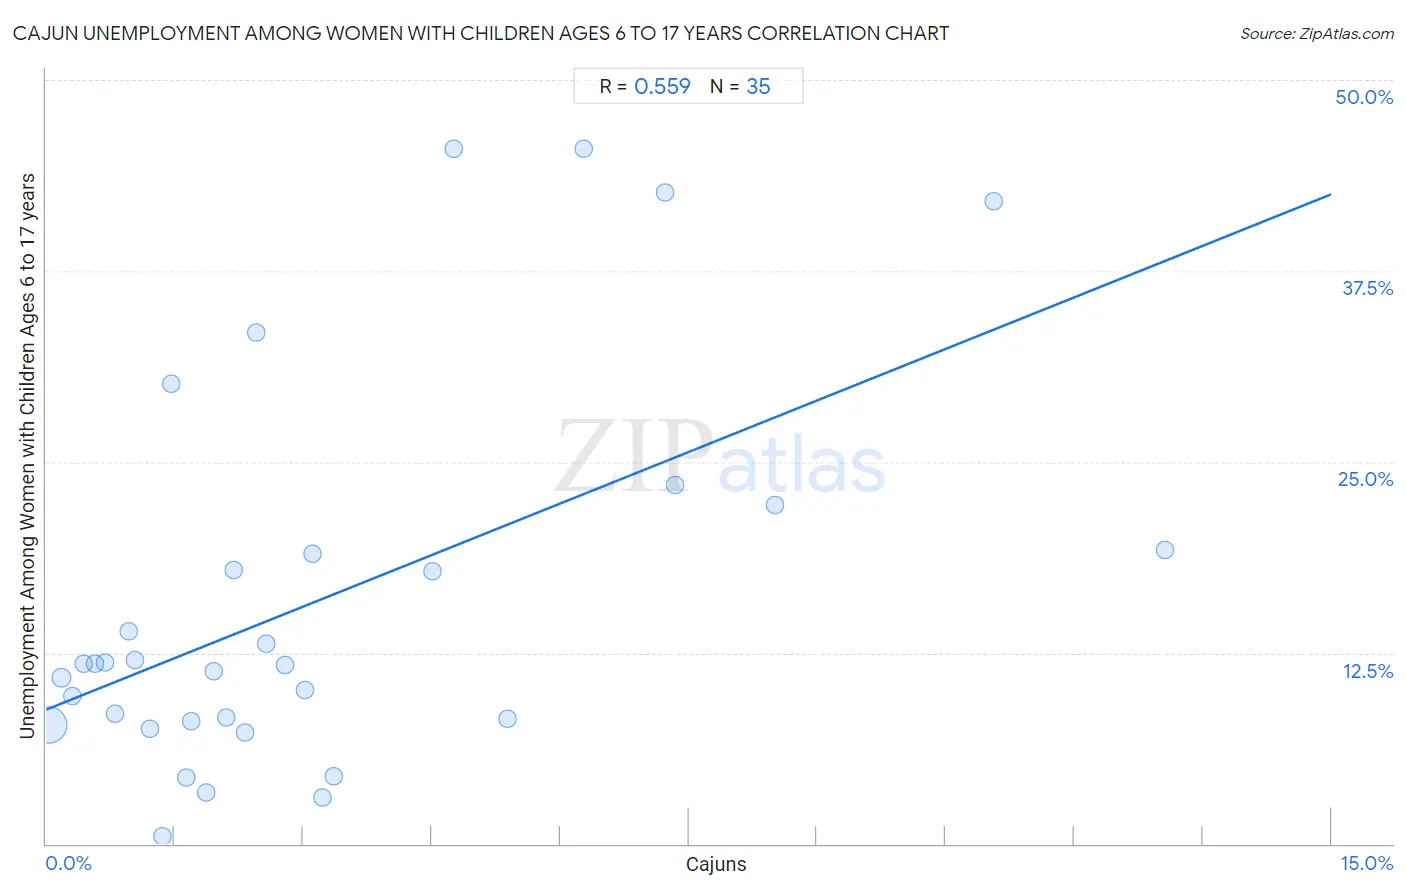
Cajun Unemployment Among Women with Children Ages 6 to 17 years Correlation Chart
The statistical analysis conducted on geographies consisting of 120,661,780 people shows a substantial positive correlation between the proportion of Cajuns and unemployment rate among women with children between the ages 6 and 17 in the United States with a correlation coefficient (R) of 0.559 and weighted average of 10.8%. On average, for every 1% (one percent) increase in Cajuns within a typical geography, there is an increase of 2.2% in unemployment rate among women with children between the ages 6 and 17.
It is essential to understand that the correlation between the percentage of Cajuns and unemployment rate among women with children between the ages 6 and 17 does not imply a direct cause-and-effect relationship. It remains uncertain whether the presence of Cajuns influences an upward or downward trend in the level of unemployment rate among women with children between the ages 6 and 17 within an area, or if Cajuns simply ended up residing in those areas with higher or lower levels of unemployment rate among women with children between the ages 6 and 17 due to other factors.
Demographics Similar to Cajuns by Unemployment Among Women with Children Ages 6 to 17 years
In terms of unemployment among women with children ages 6 to 17 years, the demographic groups most similar to Cajuns are Liberian (10.8%, a difference of 0.070%), Cape Verdean (10.9%, a difference of 0.13%), Immigrants from Dominican Republic (10.8%, a difference of 0.18%), Dominican (10.8%, a difference of 0.24%), and Ottawa (10.9%, a difference of 0.27%).
| Demographics | Rating | Rank | Unemployment Among Women with Children Ages 6 to 17 years |
| Delaware | 0.0 /100 | #318 | Tragic 10.5% |
| Immigrants from Uganda | 0.0 /100 | #319 | Tragic 10.7% |
| Apache | 0.0 /100 | #320 | Tragic 10.7% |
| Tohono O'odham | 0.0 /100 | #321 | Tragic 10.7% |
| Cree | 0.0 /100 | #322 | Tragic 10.8% |
| Dominicans | 0.0 /100 | #323 | Tragic 10.8% |
| Immigrants from Dominican Republic | 0.0 /100 | #324 | Tragic 10.8% |
| Cajuns | 0.0 /100 | #325 | Tragic 10.8% |
| Liberians | 0.0 /100 | #326 | Tragic 10.8% |
| Cape Verdeans | 0.0 /100 | #327 | Tragic 10.9% |
| Ottawa | 0.0 /100 | #328 | Tragic 10.9% |
| Pennsylvania Germans | 0.0 /100 | #329 | Tragic 11.0% |
| Chippewa | 0.0 /100 | #330 | Tragic 11.1% |
| Blacks/African Americans | 0.0 /100 | #331 | Tragic 11.4% |
| Tsimshian | 0.0 /100 | #332 | Tragic 11.4% |
Cajun Unemployment Among Women with Children Ages 6 to 17 years Correlation Summary
| Measurement | Cajun Data | Unemployment Among Women with Children Ages 6 to 17 years Data |
| Minimum | 0.025% | 0.48% |
| Maximum | 13.1% | 45.5% |
| Range | 13.0% | 45.0% |
| Mean | 3.2% | 15.9% |
| Median | 2.2% | 11.8% |
| Interquartile 25% (IQ1) | 1.0% | 8.0% |
| Interquartile 75% (IQ3) | 4.5% | 19.2% |
| Interquartile Range (IQR) | 3.5% | 11.2% |
| Standard Deviation (Sample) | 3.1% | 12.5% |
| Standard Deviation (Population) | 3.0% | 12.3% |
Correlation Details
| Cajun Percentile | Sample Size | Unemployment Among Women with Children Ages 6 to 17 years |
[ 0.0% - 0.5% ] 0.025% | 111,053,099 | 7.7% |
[ 0.0% - 0.5% ] 0.18% | 4,898,142 | 10.8% |
[ 0.0% - 0.5% ] 0.31% | 1,875,251 | 9.7% |
[ 0.0% - 0.5% ] 0.43% | 712,599 | 11.8% |
[ 0.5% - 1.0% ] 0.56% | 413,278 | 11.8% |
[ 0.5% - 1.0% ] 0.69% | 179,058 | 11.9% |
[ 0.5% - 1.0% ] 0.81% | 299,224 | 8.5% |
[ 0.5% - 1.0% ] 0.97% | 161,095 | 13.9% |
[ 1.0% - 1.5% ] 1.03% | 135,043 | 12.0% |
[ 1.0% - 1.5% ] 1.21% | 65,479 | 7.5% |
[ 1.0% - 1.5% ] 1.36% | 42,140 | 0.48% |
[ 1.0% - 1.5% ] 1.46% | 43,062 | 30.1% |
[ 1.5% - 2.0% ] 1.63% | 39,501 | 4.3% |
[ 1.5% - 2.0% ] 1.69% | 41,507 | 8.0% |
[ 1.5% - 2.0% ] 1.86% | 127,084 | 3.3% |
[ 1.5% - 2.0% ] 1.95% | 102,679 | 11.3% |
[ 2.0% - 2.5% ] 2.10% | 18,701 | 8.3% |
[ 2.0% - 2.5% ] 2.19% | 15,218 | 17.9% |
[ 2.0% - 2.5% ] 2.33% | 53,415 | 7.3% |
[ 2.0% - 2.5% ] 2.46% | 28,660 | 33.5% |
[ 2.5% - 3.0% ] 2.56% | 21,998 | 13.1% |
[ 2.5% - 3.0% ] 2.79% | 35,596 | 11.7% |
[ 3.0% - 3.5% ] 3.02% | 33,056 | 10.1% |
[ 3.0% - 3.5% ] 3.10% | 42,146 | 18.9% |
[ 3.0% - 3.5% ] 3.22% | 99,140 | 3.0% |
[ 3.0% - 3.5% ] 3.35% | 28,363 | 4.4% |
[ 4.5% - 5.0% ] 4.51% | 23,864 | 17.8% |
[ 4.5% - 5.0% ] 4.76% | 3,362 | 45.5% |
[ 5.0% - 5.5% ] 5.38% | 2,231 | 8.2% |
[ 6.0% - 6.5% ] 6.28% | 3,297 | 45.5% |
[ 7.0% - 7.5% ] 7.22% | 11,726 | 42.6% |
[ 7.0% - 7.5% ] 7.34% | 24,688 | 23.5% |
[ 8.5% - 9.0% ] 8.50% | 13,329 | 22.2% |
[ 11.0% - 11.5% ] 11.06% | 5,423 | 42.1% |
[ 13.0% - 13.5% ] 13.06% | 9,326 | 19.2% |