Cajun 3 or more Vehicles in Household
COMPARE
Cajun
Select to Compare
3 or more Vehicles in Household
Cajun 3 or more Vehicles in Household
19.3%
3+ VEHICLES AVAILABLE
36.0/ 100
METRIC RATING
183rd/ 347
METRIC RANK
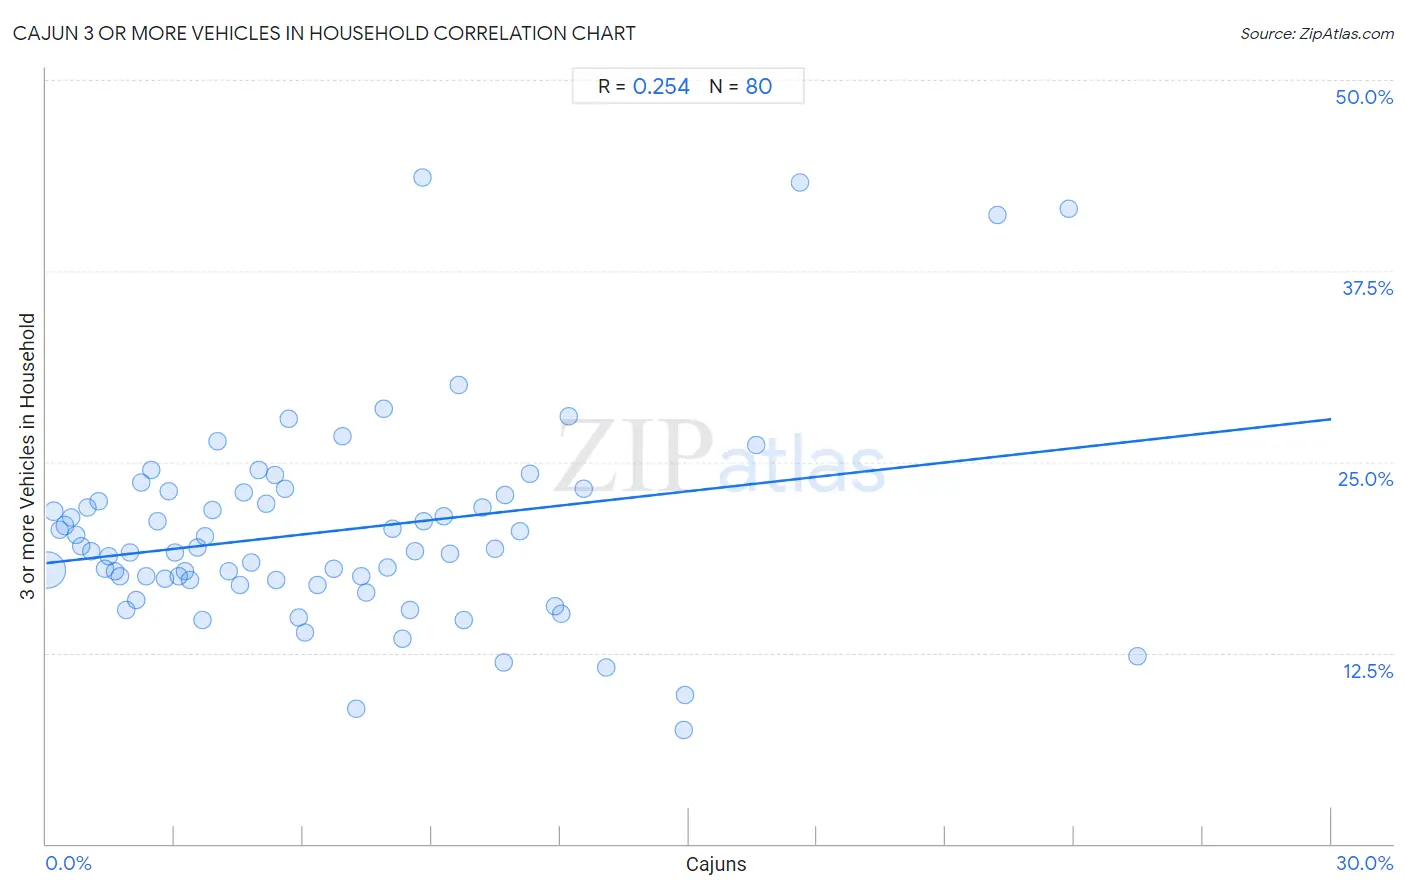
Cajun 3 or more Vehicles in Household Correlation Chart
The statistical analysis conducted on geographies consisting of 149,681,438 people shows a weak positive correlation between the proportion of Cajuns and percentage of households with 3 or more vehicles available in the United States with a correlation coefficient (R) of 0.254 and weighted average of 19.3%. On average, for every 1% (one percent) increase in Cajuns within a typical geography, there is an increase of 0.31% in percentage of households with 3 or more vehicles available.
It is essential to understand that the correlation between the percentage of Cajuns and percentage of households with 3 or more vehicles available does not imply a direct cause-and-effect relationship. It remains uncertain whether the presence of Cajuns influences an upward or downward trend in the level of percentage of households with 3 or more vehicles available within an area, or if Cajuns simply ended up residing in those areas with higher or lower levels of percentage of households with 3 or more vehicles available due to other factors.
Demographics Similar to Cajuns by 3 or more Vehicles in Household
In terms of 3 or more vehicles in household, the demographic groups most similar to Cajuns are Latvian (19.3%, a difference of 0.020%), Cuban (19.3%, a difference of 0.050%), Romanian (19.3%, a difference of 0.090%), South African (19.3%, a difference of 0.13%), and Immigrants from South Central Asia (19.3%, a difference of 0.24%).
| Demographics | Rating | Rank | 3 or more Vehicles in Household |
| Iroquois | 46.0 /100 | #176 | Average 19.4% |
| Immigrants from Peru | 41.1 /100 | #177 | Average 19.4% |
| Immigrants from Syria | 40.3 /100 | #178 | Average 19.4% |
| Immigrants from South Central Asia | 38.9 /100 | #179 | Fair 19.3% |
| South Africans | 37.5 /100 | #180 | Fair 19.3% |
| Romanians | 37.1 /100 | #181 | Fair 19.3% |
| Cubans | 36.6 /100 | #182 | Fair 19.3% |
| Cajuns | 36.0 /100 | #183 | Fair 19.3% |
| Latvians | 35.7 /100 | #184 | Fair 19.3% |
| Immigrants from Sri Lanka | 30.7 /100 | #185 | Fair 19.2% |
| Immigrants from Sweden | 29.0 /100 | #186 | Fair 19.2% |
| Immigrants from Hong Kong | 28.3 /100 | #187 | Fair 19.2% |
| Immigrants from Kuwait | 26.1 /100 | #188 | Fair 19.1% |
| Indians (Asian) | 26.0 /100 | #189 | Fair 19.1% |
| Immigrants from Zimbabwe | 25.5 /100 | #190 | Fair 19.1% |
Cajun 3 or more Vehicles in Household Correlation Summary
| Measurement | Cajun Data | 3 or more Vehicles in Household Data |
| Minimum | 0.029% | 7.4% |
| Maximum | 25.5% | 43.7% |
| Range | 25.4% | 36.2% |
| Mean | 6.7% | 20.5% |
| Median | 5.5% | 19.2% |
| Interquartile 25% (IQ1) | 2.5% | 17.2% |
| Interquartile 75% (IQ3) | 9.5% | 22.9% |
| Interquartile Range (IQR) | 7.0% | 5.7% |
| Standard Deviation (Sample) | 5.4% | 6.7% |
| Standard Deviation (Population) | 5.4% | 6.7% |
Correlation Details
| Cajun Percentile | Sample Size | 3 or more Vehicles in Household |
[ 0.0% - 0.5% ] 0.029% | 130,741,085 | 17.9% |
[ 0.0% - 0.5% ] 0.18% | 9,197,021 | 21.8% |
[ 0.0% - 0.5% ] 0.31% | 3,468,847 | 20.5% |
[ 0.0% - 0.5% ] 0.44% | 1,251,796 | 20.8% |
[ 0.5% - 1.0% ] 0.57% | 867,880 | 21.3% |
[ 0.5% - 1.0% ] 0.69% | 686,310 | 20.2% |
[ 0.5% - 1.0% ] 0.81% | 509,497 | 19.5% |
[ 0.5% - 1.0% ] 0.96% | 388,772 | 22.0% |
[ 1.0% - 1.5% ] 1.06% | 349,044 | 19.1% |
[ 1.0% - 1.5% ] 1.21% | 156,759 | 22.4% |
[ 1.0% - 1.5% ] 1.36% | 139,631 | 18.0% |
[ 1.0% - 1.5% ] 1.47% | 174,374 | 18.8% |
[ 1.5% - 2.0% ] 1.61% | 127,070 | 17.8% |
[ 1.5% - 2.0% ] 1.71% | 102,631 | 17.5% |
[ 1.5% - 2.0% ] 1.86% | 154,972 | 15.3% |
[ 1.5% - 2.0% ] 1.96% | 176,850 | 19.1% |
[ 2.0% - 2.5% ] 2.09% | 132,222 | 16.0% |
[ 2.0% - 2.5% ] 2.22% | 46,990 | 23.7% |
[ 2.0% - 2.5% ] 2.33% | 70,844 | 17.5% |
[ 2.0% - 2.5% ] 2.46% | 79,335 | 24.5% |
[ 2.5% - 3.0% ] 2.61% | 116,910 | 21.1% |
[ 2.5% - 3.0% ] 2.77% | 54,387 | 17.4% |
[ 2.5% - 3.0% ] 2.86% | 8,422 | 23.1% |
[ 3.0% - 3.5% ] 3.01% | 39,547 | 19.1% |
[ 3.0% - 3.5% ] 3.09% | 100,522 | 17.5% |
[ 3.0% - 3.5% ] 3.23% | 121,203 | 17.8% |
[ 3.0% - 3.5% ] 3.37% | 60,216 | 17.3% |
[ 3.5% - 4.0% ] 3.53% | 538 | 19.4% |
[ 3.5% - 4.0% ] 3.64% | 6,211 | 14.7% |
[ 3.5% - 4.0% ] 3.71% | 18,577 | 20.1% |
[ 3.5% - 4.0% ] 3.89% | 3,417 | 21.8% |
[ 4.0% - 4.5% ] 4.01% | 31,642 | 26.4% |
[ 4.0% - 4.5% ] 4.25% | 6,498 | 17.8% |
[ 4.5% - 5.0% ] 4.51% | 27,050 | 17.0% |
[ 4.5% - 5.0% ] 4.61% | 3,794 | 23.0% |
[ 4.5% - 5.0% ] 4.79% | 13,079 | 18.4% |
[ 4.5% - 5.0% ] 4.96% | 6,507 | 24.5% |
[ 5.0% - 5.5% ] 5.13% | 19,497 | 22.3% |
[ 5.0% - 5.5% ] 5.34% | 8,858 | 24.1% |
[ 5.0% - 5.5% ] 5.38% | 2,474 | 17.2% |
[ 5.5% - 6.0% ] 5.56% | 5,108 | 23.3% |
[ 5.5% - 6.0% ] 5.66% | 7,665 | 27.8% |
[ 5.5% - 6.0% ] 5.89% | 7,606 | 14.8% |
[ 6.0% - 6.5% ] 6.03% | 9,639 | 13.8% |
[ 6.0% - 6.5% ] 6.33% | 7,809 | 17.0% |
[ 6.5% - 7.0% ] 6.72% | 16,937 | 18.0% |
[ 6.5% - 7.0% ] 6.90% | 9,823 | 26.6% |
[ 7.0% - 7.5% ] 7.22% | 12,059 | 8.8% |
[ 7.0% - 7.5% ] 7.34% | 31,076 | 17.5% |
[ 7.0% - 7.5% ] 7.47% | 5,579 | 16.5% |
[ 7.5% - 8.0% ] 7.88% | 2,437 | 28.5% |
[ 7.5% - 8.0% ] 7.96% | 1,659 | 18.1% |
[ 8.0% - 8.5% ] 8.09% | 5,528 | 20.6% |
[ 8.0% - 8.5% ] 8.32% | 2,633 | 13.4% |
[ 8.5% - 9.0% ] 8.50% | 13,329 | 15.3% |
[ 8.5% - 9.0% ] 8.60% | 2,023 | 19.1% |
[ 8.5% - 9.0% ] 8.78% | 1,766 | 43.7% |
[ 8.5% - 9.0% ] 8.81% | 885 | 21.1% |
[ 9.0% - 9.5% ] 9.29% | 915 | 21.5% |
[ 9.0% - 9.5% ] 9.43% | 23,891 | 19.0% |
[ 9.5% - 10.0% ] 9.64% | 1,473 | 30.0% |
[ 9.5% - 10.0% ] 9.76% | 1,445 | 14.6% |
[ 10.0% - 10.5% ] 10.18% | 855 | 22.0% |
[ 10.0% - 10.5% ] 10.47% | 1,518 | 19.3% |
[ 10.5% - 11.0% ] 10.69% | 8,271 | 11.9% |
[ 10.5% - 11.0% ] 10.71% | 1,223 | 22.9% |
[ 11.0% - 11.5% ] 11.06% | 5,423 | 20.5% |
[ 11.0% - 11.5% ] 11.29% | 62 | 24.2% |
[ 11.5% - 12.0% ] 11.87% | 691 | 15.5% |
[ 12.0% - 12.5% ] 12.01% | 2,215 | 15.1% |
[ 12.0% - 12.5% ] 12.21% | 860 | 28.0% |
[ 12.5% - 13.0% ] 12.55% | 1,147 | 23.2% |
[ 13.0% - 13.5% ] 13.06% | 9,326 | 11.5% |
[ 14.5% - 15.0% ] 14.89% | 47 | 7.4% |
[ 14.5% - 15.0% ] 14.92% | 1,220 | 9.7% |
[ 16.5% - 17.0% ] 16.57% | 3,754 | 26.1% |
[ 17.5% - 18.0% ] 17.59% | 216 | 43.3% |
[ 22.0% - 22.5% ] 22.22% | 207 | 41.2% |
[ 23.5% - 24.0% ] 23.87% | 398 | 41.5% |
[ 25.0% - 25.5% ] 25.47% | 1,441 | 12.3% |