Austrian Disability

COMPARE

Austrian
Race
Ancestry
AfghanAfricanAlaska NativeAlaskan AthabascanAlbanianAleutAlsatianAmericanApacheArabArapahoArgentineanArmenianAssyrian/Chaldean/SyriacAustralianAustrianBahamianBangladeshiBarbadianBasqueBelgianBelizeanBermudanBhutaneseBlackfeetBolivianBrazilianBritishBritish West IndianBulgarianBurmeseCajunCambodianCanadianCape VerdeanCarpatho RusynCelticCentral AmericanCentral American IndianCherokeeCheyenneChickasawChileanChineseChippewaChoctawColombianColvilleComancheCosta RicanCreeCreekCroatianCrowCubanCypriotCzechCzechoslovakianDanishDelawareDominicanDutchDutch West IndianEastern EuropeanEcuadorianEgyptianEnglishEstonianEthiopianEuropeanFijianFilipinoFinnishFrenchFrench American IndianFrench CanadianGermanGerman RussianGhanaianGreekGuamanian/ChamorroGuatemalanGuyaneseHaitianHmongHonduranHopiHoumaHungarianIcelanderIndian (Asian)IndonesianInupiatIranianIraqiIrishIroquoisIsraeliItalianJamaicanJapaneseJordanianKenyanKiowaKoreanLaotianLatvianLebaneseLiberianLithuanianLumbeeLuxembourgerMacedonianMalaysianMalteseMarshalleseMenomineeMexicanMexican American IndianMongolianMoroccanNative HawaiianNavajoNepaleseNew ZealanderNicaraguanNigerianNorthern EuropeanNorwegianOkinawanOsageOttawaPaiutePakistaniPalestinianPanamanianParaguayanPennsylvania GermanPeruvianPimaPolishPortuguesePotawatomiPuebloPuerto RicanPuget Sound SalishRomanianRussianSalvadoranSamoanScandinavianScotch-IrishScottishSeminoleSenegaleseSerbianShoshoneSierra LeoneanSiouxSlavicSlovakSloveneSomaliSouth AfricanSouth AmericanSouth American IndianSoviet UnionSpaniardSpanishSpanish AmericanSpanish American IndianSri LankanSubsaharan AfricanSudaneseSwedishSwissSyrianTaiwaneseThaiTlingit-HaidaTohono O'OdhamTonganTrinidadian and TobagonianTsimshianTurkishU.S. Virgin IslanderUgandanUkrainianUruguayanUteVenezuelanVietnameseWelshWest IndianYakamaYaquiYugoslavianYumanYup'ikZimbabwean
Immigration
NonimmigrantsImmigrantsAfghanistanAfricaAlbaniaArgentinaArmeniaAsiaAustraliaAustriaBahamasBangladeshBarbadosBelarusBelgiumBelizeBoliviaBosnia and HerzegovinaBrazilBulgariaBurma/MyanmarCabo VerdeCambodiaCameroonCanadaCaribbeanCentral AmericaChileChinaColombiaCongoCosta RicaCroatiaCubaCzechoslovakiaDenmarkDominicaDominican RepublicEastern AfricaEastern AsiaEastern EuropeEcuadorEgyptEl SalvadorEnglandEritreaEthiopiaEuropeFijiFranceGermanyGhanaGreeceGrenadaGuatemalaGuyanaHaitiHondurasHong KongHungaryIndiaIndonesiaIranIraqIrelandIsraelItalyJamaicaJapanJordanKazakhstanKenyaKoreaKuwaitLaosLatin AmericaLatviaLebanonLiberiaLithuaniaMalaysiaMexicoMicronesiaMiddle AfricaMoldovaMoroccoNepalNetherlandsNicaraguaNigeriaNorth AmericaNorth MacedoniaNorthern AfricaNorthern EuropeNorwayOceaniaPakistanPanamaPeruPhilippinesPolandPortugalRomaniaRussiaSaudi ArabiaScotlandSenegalSerbiaSierra LeoneSingaporeSomaliaSouth AfricaSouth AmericaSouth Central AsiaSouth Eastern AsiaSouthern EuropeSpainSri LankaSt. Vincent and the GrenadinesSudanSwedenSwitzerlandSyriaTaiwanThailandTrinidad and TobagoTurkeyUgandaUkraineUruguayUzbekistanVenezuelaVietnamWest IndiesWestern AfricaWestern AsiaWestern EuropeYemenZaireZimbabweAzores
Select to Compare
Race
Ancestry
AfghanAfricanAlaska NativeAlaskan AthabascanAlbanianAleutAlsatianAmericanApacheArabArapahoArgentineanArmenianAssyrian/Chaldean/SyriacAustralianBahamianBangladeshiBarbadianBasqueBelgianBelizeanBermudanBhutaneseBlackfeetBolivianBrazilianBritishBritish West IndianBulgarianBurmeseCajunCambodianCanadianCape VerdeanCarpatho RusynCelticCentral AmericanCentral American IndianCherokeeCheyenneChickasawChileanChineseChippewaChoctawColombianColvilleComancheCosta RicanCreeCreekCroatianCrowCubanCypriotCzechCzechoslovakianDanishDelawareDominicanDutchDutch West IndianEastern EuropeanEcuadorianEgyptianEnglishEstonianEthiopianEuropeanFijianFilipinoFinnishFrenchFrench American IndianFrench CanadianGermanGerman RussianGhanaianGreekGuamanian/ChamorroGuatemalanGuyaneseHaitianHmongHonduranHopiHoumaHungarianIcelanderIndian (Asian)IndonesianInupiatIranianIraqiIrishIroquoisIsraeliItalianJamaicanJapaneseJordanianKenyanKiowaKoreanLaotianLatvianLebaneseLiberianLithuanianLumbeeLuxembourgerMacedonianMalaysianMalteseMarshalleseMenomineeMexicanMexican American IndianMongolianMoroccanNative HawaiianNavajoNepaleseNew ZealanderNicaraguanNigerianNorthern EuropeanNorwegianOkinawanOsageOttawaPaiutePakistaniPalestinianPanamanianParaguayanPennsylvania GermanPeruvianPimaPolishPortuguesePotawatomiPuebloPuerto RicanPuget Sound SalishRomanianRussianSalvadoranSamoanScandinavianScotch-IrishScottishSeminoleSenegaleseSerbianShoshoneSierra LeoneanSiouxSlavicSlovakSloveneSomaliSouth AfricanSouth AmericanSouth American IndianSoviet UnionSpaniardSpanishSpanish AmericanSpanish American IndianSri LankanSubsaharan AfricanSudaneseSwedishSwissSyrianTaiwaneseThaiTlingit-HaidaTohono O'OdhamTonganTrinidadian and TobagonianTsimshianTurkishU.S. Virgin IslanderUgandanUkrainianUruguayanUteVenezuelanVietnameseWelshWest IndianYakamaYaquiYugoslavianYumanYup'ikZimbabwean
Immigration
NonimmigrantsImmigrantsAfghanistanAfricaAlbaniaArgentinaArmeniaAsiaAustraliaAustriaBahamasBangladeshBarbadosBelarusBelgiumBelizeBoliviaBosnia and HerzegovinaBrazilBulgariaBurma/MyanmarCabo VerdeCambodiaCameroonCanadaCaribbeanCentral AmericaChileChinaColombiaCongoCosta RicaCroatiaCubaCzechoslovakiaDenmarkDominicaDominican RepublicEastern AfricaEastern AsiaEastern EuropeEcuadorEgyptEl SalvadorEnglandEritreaEthiopiaEuropeFijiFranceGermanyGhanaGreeceGrenadaGuatemalaGuyanaHaitiHondurasHong KongHungaryIndiaIndonesiaIranIraqIrelandIsraelItalyJamaicaJapanJordanKazakhstanKenyaKoreaKuwaitLaosLatin AmericaLatviaLebanonLiberiaLithuaniaMalaysiaMexicoMicronesiaMiddle AfricaMoldovaMoroccoNepalNetherlandsNicaraguaNigeriaNorth AmericaNorth MacedoniaNorthern AfricaNorthern EuropeNorwayOceaniaPakistanPanamaPeruPhilippinesPolandPortugalRomaniaRussiaSaudi ArabiaScotlandSenegalSerbiaSierra LeoneSingaporeSomaliaSouth AfricaSouth AmericaSouth Central AsiaSouth Eastern AsiaSouthern EuropeSpainSri LankaSt. Vincent and the GrenadinesSudanSwedenSwitzerlandSyriaTaiwanThailandTrinidad and TobagoTurkeyUgandaUkraineUruguayUzbekistanVenezuelaVietnamWest IndiesWestern AfricaWestern AsiaWestern EuropeYemenZaireZimbabweAzores
Disability
Income
Poverty
Unemployment
Labor Participation
Family Structure
Vehicle Availability
Education Level
Disability

Austrian Disability
Tragic

12.0%
DISABILITY
7.2/ 100
METRIC RATING
212th/ 347
METRIC RANK

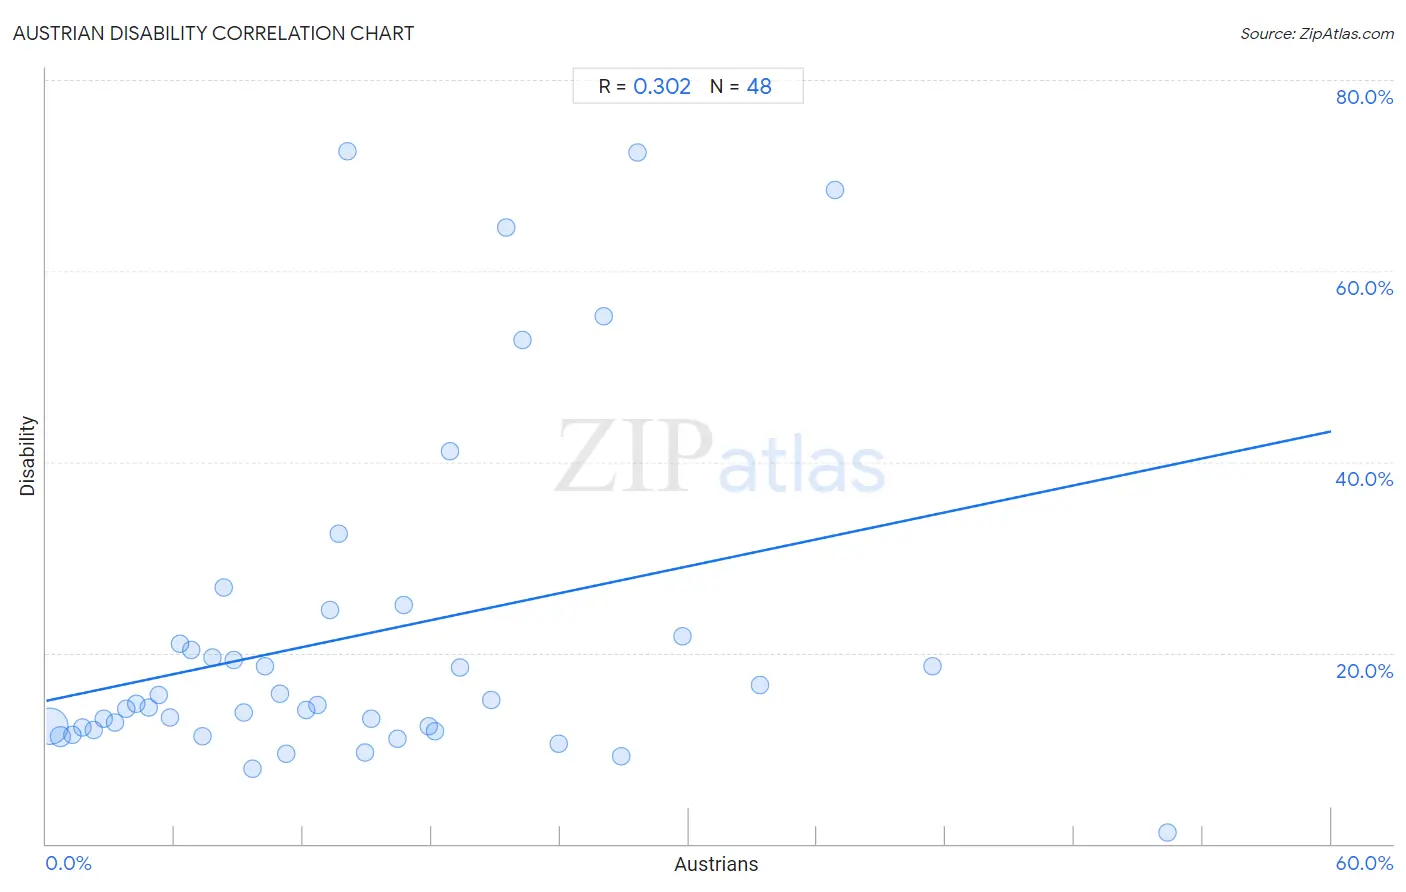
Austrian Disability Correlation Chart

The statistical analysis conducted on geographies consisting of 452,057,102 people shows a mild positive correlation between the proportion of Austrians and percentage of population with a disability in the United States with a correlation coefficient (R) of 0.302 and weighted average of 12.0%. On average, for every 1% (one percent) increase in Austrians within a typical geography, there is an increase of 0.47% in percentage of population with a disability.
Austrian Disability
It is essential to understand that the correlation between the percentage of Austrians and percentage of population with a disability does not imply a direct cause-and-effect relationship. It remains uncertain whether the presence of Austrians influences an upward or downward trend in the level of percentage of population with a disability within an area, or if Austrians simply ended up residing in those areas with higher or lower levels of percentage of population with a disability due to other factors.

Demographics Similar to Austrians by Disability

In terms of disability, the demographic groups most similar to Austrians are Immigrants from Iraq (12.0%, a difference of 0.010%), Immigrants from Cambodia (12.0%, a difference of 0.030%), Immigrants from Somalia (12.0%, a difference of 0.060%), Czech (12.0%, a difference of 0.11%), and Immigrants from Canada (12.1%, a difference of 0.18%).
DemographicsRating | RankDisability
Immigrants from Western Europe
10.1
/100
|
#205
Poor
12.0%
Immigrants from Senegal
9.4
/100
|
#206
Tragic
12.0%
Immigrants from Thailand
9.3
/100
|
#207
Tragic
12.0%
Immigrants from Caribbean
9.1
/100
|
#208
Tragic
12.0%
Danes
8.7
/100
|
#209
Tragic
12.0%
Czechs
7.9
/100
|
#210
Tragic
12.0%
Immigrants from Cambodia
7.3
/100
|
#211
Tragic
12.0%
Austrians
7.2
/100
|
#212
Tragic
12.0%
Immigrants from Iraq
7.1
/100
|
#213
Tragic
12.0%
Immigrants from Somalia
6.8
/100
|
#214
Tragic
12.0%
Immigrants from Canada
6.1
/100
|
#215
Tragic
12.1%
Panamanians
5.4
/100
|
#216
Tragic
12.1%
Immigrants from North America
5.3
/100
|
#217
Tragic
12.1%
Immigrants from Jamaica
5.0
/100
|
#218
Tragic
12.1%
Croatians
4.9
/100
|
#219
Tragic
12.1%

Austrian Disability Correlation Summary

MeasurementAustrian DataDisability Data
Minimum0.17%1.2%
Maximum52.3%72.5%
Range52.2%71.4%
Mean14.5%21.8%
Median12.4%14.6%
Interquartile 25% (IQ1)6.0%12.1%
Interquartile 75% (IQ3)20.1%21.4%
Interquartile Range (IQR)14.0%9.3%
Standard Deviation (Sample)11.3%17.7%
Standard Deviation (Population)11.2%17.5%

Correlation Details

Austrian PercentileSample SizeDisability
[
0.0%
-
0.5%
]
0.17%
406,543,88912.3%
[
0.5%
-
1.0%
]
0.67%
36,564,64611.2%
[
1.0%
-
1.5%
]
1.20%
6,162,00611.4%
[
1.5%
-
2.0%
]
1.70%
1,580,23912.2%
[
2.0%
-
2.5%
]
2.20%
472,71012.0%
[
2.5%
-
3.0%
]
2.70%
274,07013.1%
[
3.0%
-
3.5%
]
3.20%
142,89812.7%
[
3.5%
-
4.0%
]
3.71%
107,71914.1%
[
4.0%
-
4.5%
]
4.18%
73,99714.6%
[
4.5%
-
5.0%
]
4.79%
28,77914.3%
[
5.0%
-
5.5%
]
5.23%
18,94115.6%
[
5.5%
-
6.0%
]
5.77%
12,23513.2%
[
6.0%
-
6.5%
]
6.26%
13,87521.0%
[
6.5%
-
7.0%
]
6.75%
7,42020.3%
[
7.0%
-
7.5%
]
7.28%
10,68111.2%
[
7.5%
-
8.0%
]
7.79%
7,70719.5%
[
8.0%
-
8.5%
]
8.27%
1,29426.9%
[
8.5%
-
9.0%
]
8.78%
3,41819.3%
[
9.0%
-
9.5%
]
9.25%
1,43813.7%
[
9.5%
-
10.0%
]
9.63%
4,3227.9%
[
10.0%
-
10.5%
]
10.20%
3,89118.6%
[
10.5%
-
11.0%
]
10.89%
3,76515.8%
[
11.0%
-
11.5%
]
11.19%
1,1719.4%
[
12.0%
-
12.5%
]
12.15%
74914.0%
[
12.5%
-
13.0%
]
12.68%
5,99314.6%
[
13.0%
-
13.5%
]
13.28%
58024.5%
[
13.5%
-
14.0%
]
13.68%
11732.5%
[
14.0%
-
14.5%
]
14.06%
31372.5%
[
14.5%
-
15.0%
]
14.86%
1,1989.6%
[
15.0%
-
15.5%
]
15.15%
9913.1%
[
16.0%
-
16.5%
]
16.38%
2,80211.1%
[
16.5%
-
17.0%
]
16.67%
1225.0%
[
17.5%
-
18.0%
]
17.88%
17912.3%
[
18.0%
-
18.5%
]
18.14%
39711.8%
[
18.5%
-
19.0%
]
18.83%
37741.1%
[
19.0%
-
19.5%
]
19.31%
37818.5%
[
20.5%
-
21.0%
]
20.81%
62015.0%
[
21.0%
-
21.5%
]
21.50%
10764.5%
[
22.0%
-
22.5%
]
22.22%
7252.8%
[
23.5%
-
24.0%
]
23.95%
52610.5%
[
26.0%
-
26.5%
]
26.04%
19255.2%
[
26.5%
-
27.0%
]
26.84%
6529.2%
[
27.5%
-
28.0%
]
27.59%
2972.4%
[
29.5%
-
30.0%
]
29.70%
10121.8%
[
33.0%
-
33.5%
]
33.33%
10816.7%
[
36.5%
-
37.0%
]
36.84%
1968.4%
[
41.0%
-
41.5%
]
41.40%
28518.6%
[
52.0%
-
52.5%
]
52.33%
861.2%